
The traditional blog format—regular, sequential publishing of diary-style entries—no longer makes sense for most businesses. To be honest, it never did.
A B2B website that educates potential buyers isn’t a personal “weblog.” It doesn’t toss out unsubstantiated opinions. It doesn’t age the same way. The earliest articles may cover the most valuable topics, but our throwaway content culture lets older posts rot.
If the philosophical argument doesn’t motivate you, search engines will. The CXL blog started in 2011 and, currently, includes about 700 articles. In October 2018, older posts began to decline in rankings.
This post details our process to start the transition from a “traditional” blog into a modern resource center for marketers. It also happens to be the most efficient way to get more value from existing content, a timely benefit.
Table of contents
Why up-to-date content is the new standard
Jimmy Daly deserves credit for framing the issue:
Your readers are likely not part of a growing audience, but rather a continuous stream of people with a problem to solve. At the moment they need an answer, they search Google and find you.
Your editorial calendar is invisible to most readers. If I need to find an article on creating a custom dimension in Google Analytics, I don’t care if you published it five years ago. I need it to be up to date today. And I will judge your content, site, and brand by whether or not it is.
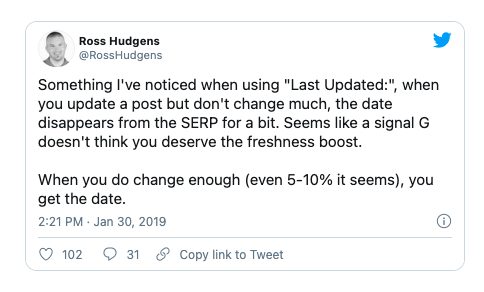
Satisfying users requires you to do more than the minimal amount to get Google to recognize an updated publish date (which, according to Ross Hudgens, is about 5–10%).
You could, of course, remove publish dates altogether (not gonna name names), but that doesn’t benefit users.
Ultimately, updating content is an iterative process to improve and improve and improve. Where do you start? From my time revising encyclopedias, I think in terms of “M” Mistakes and “m” mistakes.
- “M” Mistakes are those that, in the reference publishing world, would get you a bad review, and bad reviews tank sales.
- “m” mistakes are the tiny copy-editing mishaps that, as long as they’re few and far between, are tolerable.
In the content marketing context, there’s a parallel: “M” Mistakes are those for which someone might leave a painfully critical comment, or where you may get called out on social media; “m” mistakes are dated images or broken links.
But those are just starting points. Committing to real updates is a shift in mindset, from taking accountability for what you publish today to taking accountability for everything that’s live on your site.
Up-to-date content can be a differentiator
Anything, in the early days of the Internet, was good enough. Then, the goal was “long form” content. Brian Dean introduced the “Skyscraper Technique” in 2013 to out-long-form the long-formers. And that, ever since, has continued ad nauseum.
For search engines, length is a useful if imperfect proxy for quality, which is why Googling something like “how to create a content strategy” returns a bunch of long, detailed guides:
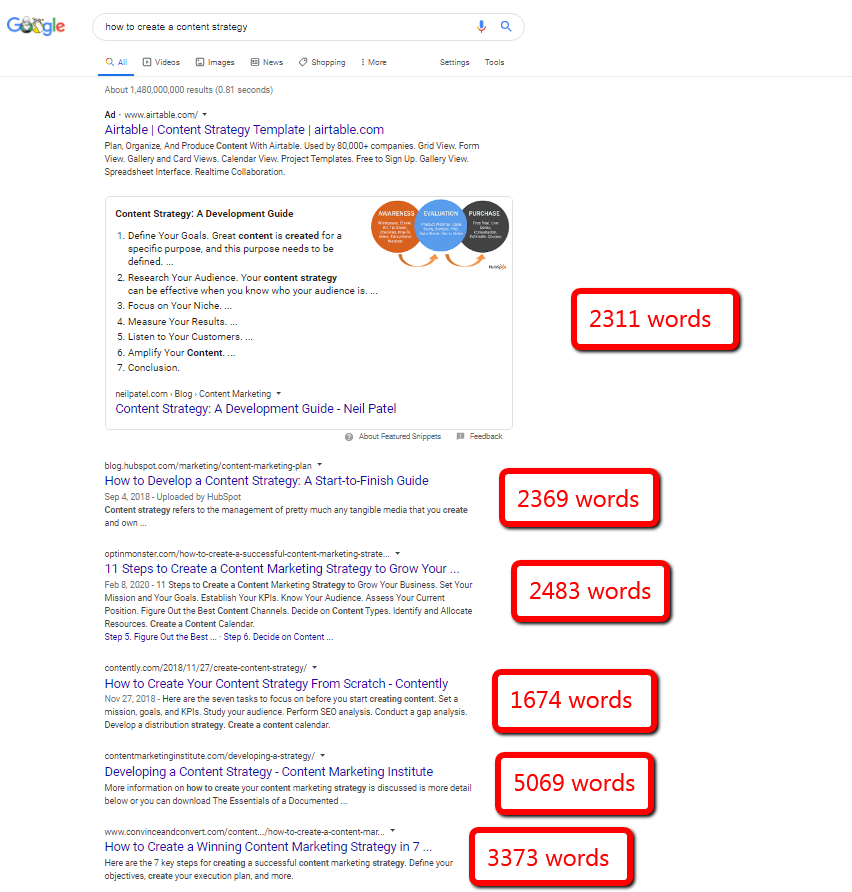
If the keywords you care about don’t yet return a list of multi-thousand-word articles, they soon will. Length is an increasingly unhelpful differentiator. (Search engines seem to be getting a bit smarter—elevating short, efficient articles—but long articles still dominate.)
For your content, you need to answer the question, “If everything on Page 1 is a well-researched, 4,000-word guide, how can I make my article stand out?”
Up-to-date content is one overlooked strategy. If I’ve come to expect that content on your site is up to date, that’s a powerful reason to click your link over another, even if you rank third or fifth.
There’s a further opportunity: creating and maintaining non-evergreen content.
When high-maintenance content is a good idea
We’re often told to make Twinkie content—stuff with a near-infinite shelf life. No expiration means no maintenance. But it also means that fewer people are publishing high-maintenance content (e.g., an article comparing prices and features of SaaS products).
Selected carefully, non-evergreen content is an opportunity to stand out. You invest time and energy to keep a handful of high-maintenance posts up to date—those for which you want to be the authority or those that bring in the most bottom-of-funnel visitors.
It’s something to keep in mind when you start updating your old content.
How to find out if updating content is the highest value activity
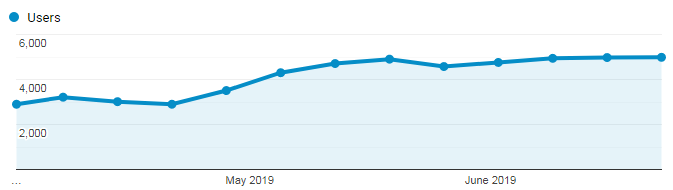
Beginning in October 2018, organic traffic to the CXL blog began to decline:
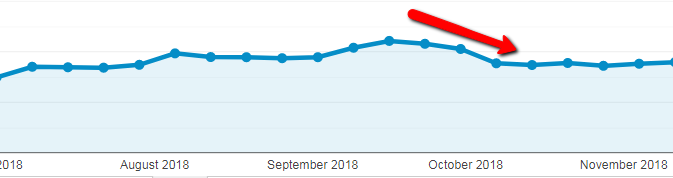
At a glance, the reasons were difficult to suss out. The drop wasn’t dramatic, and when you have hundreds of posts targeting thousands of keywords, it’s rare to see movement in unison. I woke up each day to reports that showed small movements—positive and negative—for most keywords.
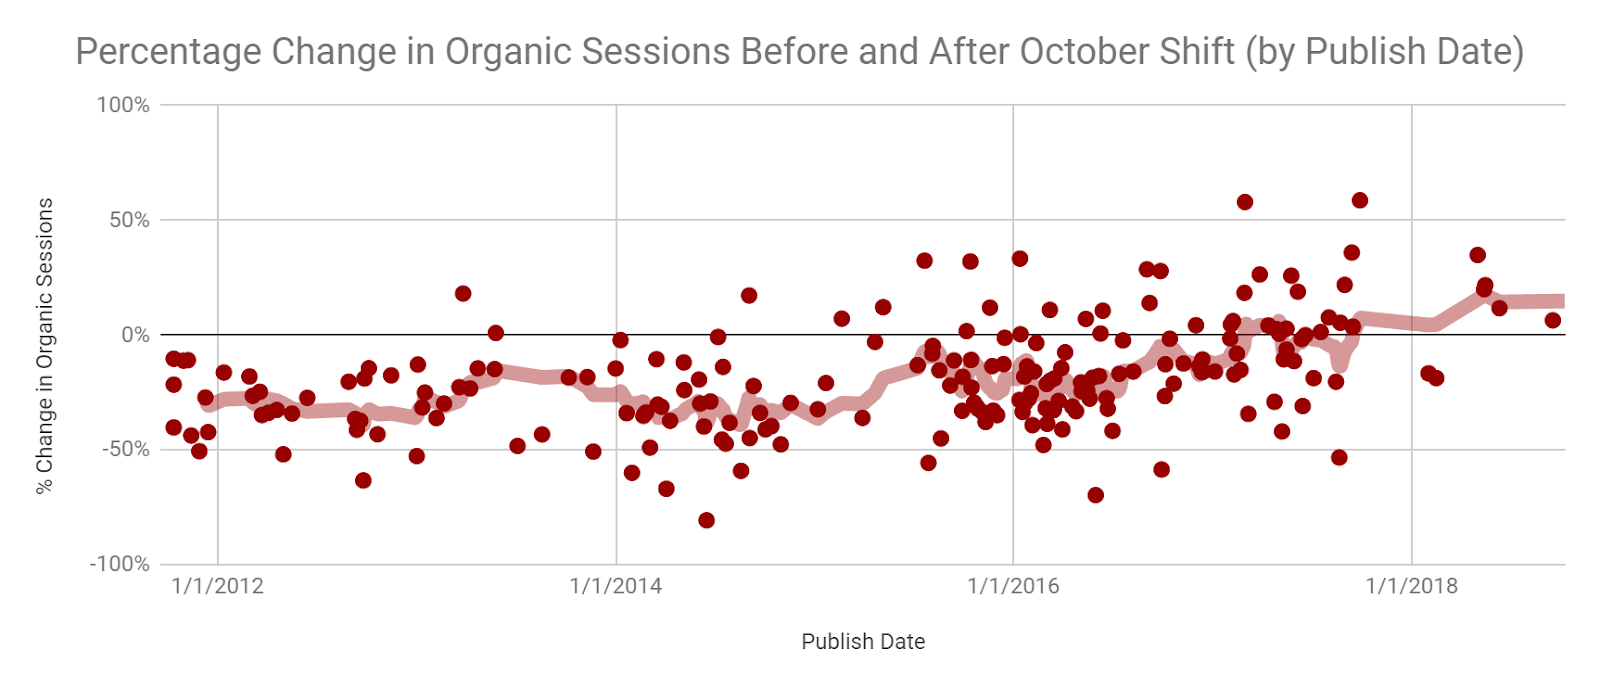
I ran a full technical SEO audit (based on Annie Cushing’s wonderful template) to ensure there wasn’t an underlying issue. The strongest evidence that old posts were responsible for the drop came from a correlation between post age and a decline in organic traffic.
Stuff that was published prior to 2016 really took a hit:
Some tools, like Animalz’s Revive, can help identify posts that recently lost organic traffic, but they can’t tell you when updating content is the content priority for your site.
There are also some limits to what traffic in general can tell you. Changes to SERP features can affect traffic even as positions stay constant.
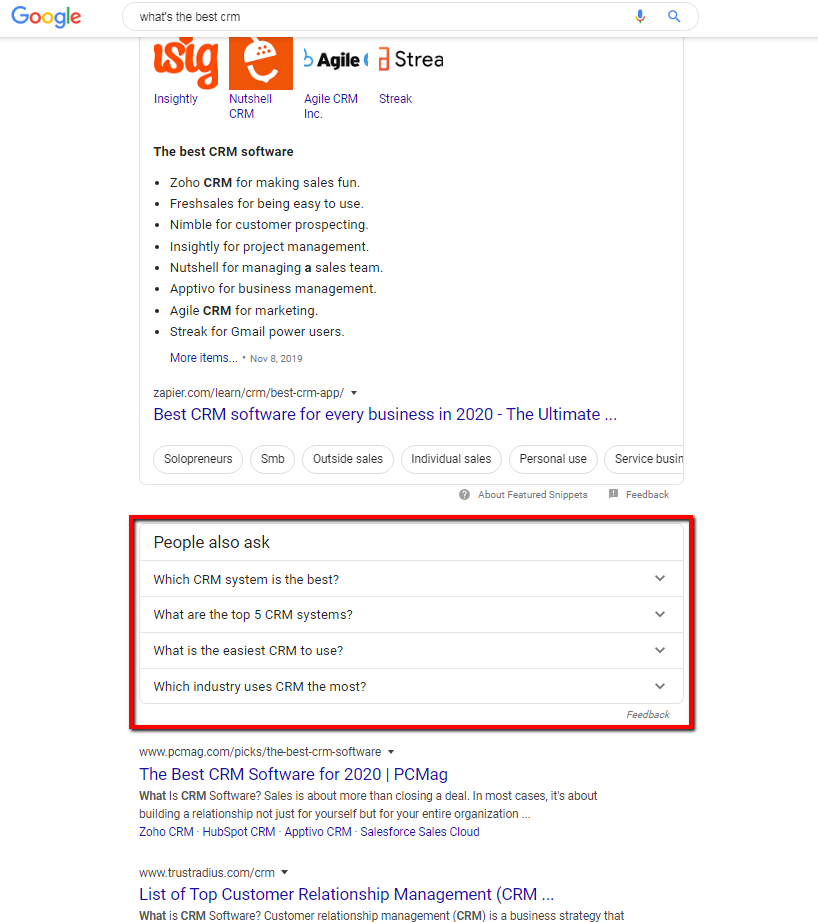
For example, Google’s choice to move a People Also Ask (PAA) box above or below our link for a high-volume keyword regularly shifted traffic by double digits.
Like some medical diagnoses, the belief that old content was our biggest problem came mainly from ruling out other technical, on-page, and off-page issues.
The site was sound. The posts were well targeted. We had the links. But rankings and traffic were still trending in the wrong direction.
Knowing that, we needed a process to continually identify the posts that:
- Most needed an update (i.e. riddled with “M” Mistakes).
- Could bring the most high-quality traffic to the site.
Our triage process for updating content
A good triage process is why you have to wait at the ER for hours to get a few stitches in your hand—but not if you’re having a heart attack.
So which posts demand immediate attention? That’s an easy decision if you have 50 articles; it’s much harder if you have 5,000. We’re somewhere in the middle. With roughly 700 posts, there are too many for a manual review, but we don’t have to automate every last metric.
The beta version of our triage sheet, which we still use today, includes seven metrics spread across four categories:
- Age;
- Historical value;
- Organic potential;
- Outdated risk.
1. Age
This is the simplest one. How long has it been since the post was (1) published or (2) received a substantial-enough update to justify a new publishing date?
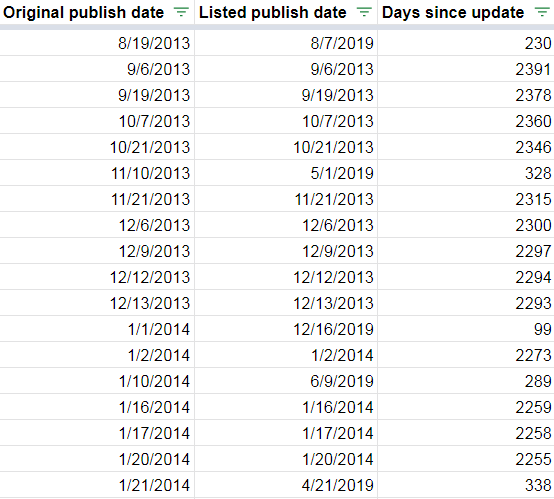
This metric is static unless a post is updated enough to change the publish date in WordPress. When that happens, we update the date in the “Listed publish date” column of the sheet, too.
2. Historical value
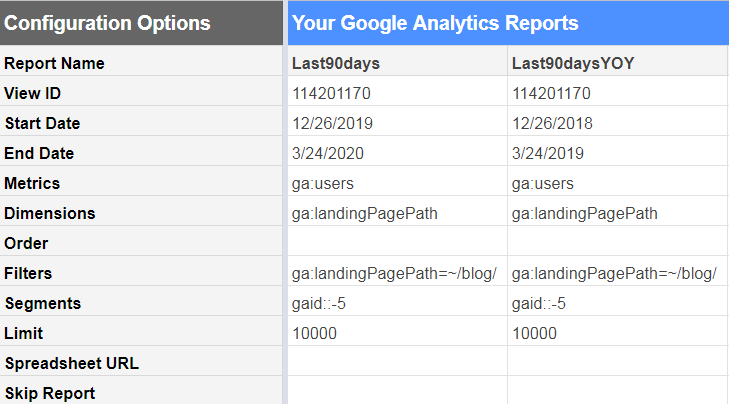
- How many organic users did the post bring in during the last 90 days?
- How do those 90-day values compare to the previous year?
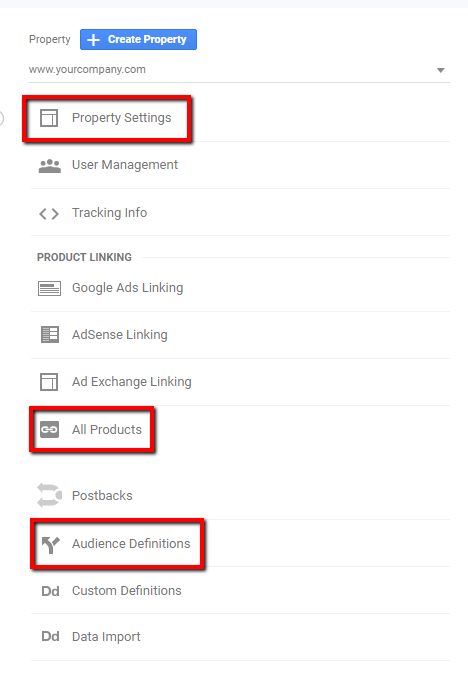
Both of these metrics are pulled into Google Sheets using the Google Analytics Add-on:
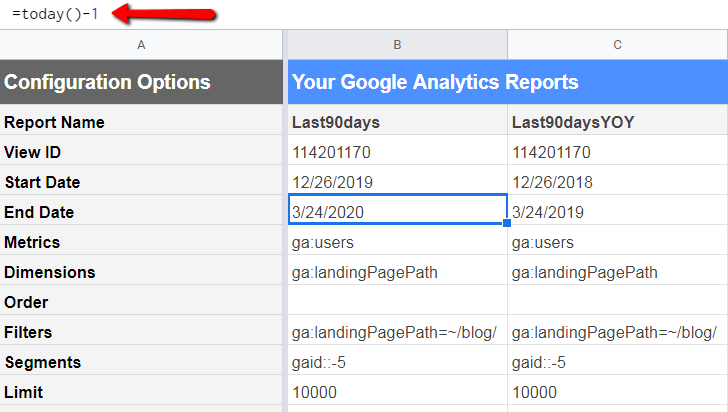
All four date values are all relative, with the report scheduled to run each morning:
3. Organic potential
- How many impressions has the post generated in the past year, according to Google Search Console? We want a sense of how many users the post could bring to the site, regardless of how many it brings now.
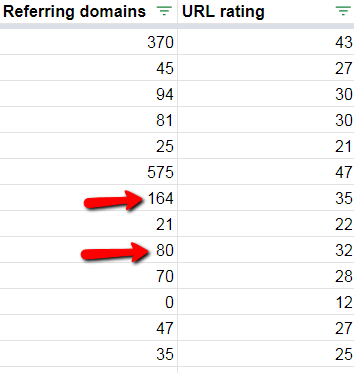
- How many referring domains does the post have? Anything that’s going to rank highly—and drive lots of traffic—will almost certainly require a decent number of links.
- What’s the URL rating? This number, pulled from Ahrefs, is a hedge against the potentially misleading number of referring domains (i.e. one link from The New York Times beats 20 from scraper sites).
I don’t expect these three metrics to change dramatically every month. You could pull this data quarterly, twice a year, or annually (as we do now). It just depends on how neurotic you are or how volatile those metrics might be for your site.
4. Outdated risk
This is a heuristic assessment of how quickly a post will seem out of date. In our context, an example of a high-risk post is our Google Analytics implementation guide. Every time a menu item or UI design element changes in Google Analytics, we have to update the post.
A low-risk post might be one on crafting a value proposition. Some examples and screenshots might start to look dated after a few years, but the core advice and process is the same.
The risk assessment, while potentially time consuming, should be a one-and-done effort. If you can make a call (on a scale from 1 to 4) in 5 seconds, that means you can tag 720 posts in an hour. Still, the process wouldn’t scale easily to tens of thousands of posts.
In those instances, you could use the blog category or tags as a rough guide (e.g., all “Analytics” posts get scored a “4”; “Copywriting” posts are scored a “2”). You’re not going to have a perfect system; get the best data you can and move on.
Turning metrics into a weighted score
For almost all metrics, I bucket raw numbers into quartiles. Quartiles give you a general sense of importance (e.g., “This post drives more traffic than 75% of posts,” or “Half of all posts have a higher URL rating than this one”), without obsessing over the extra 30 impressions per month that Google Search Console tells me a certain URL gets.
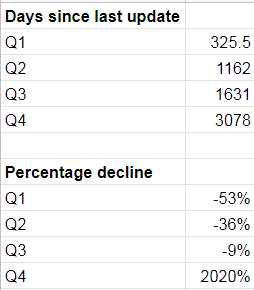
So, in the example below, all I really need to know is that the posts most in need of an update are at least 4.5 years (1,631 days) old, and those suffering the worst declines in organic traffic have lost at least 53% of organic users compared to the same 90-day period last year.
The quartile function (=QUARTILE) is native to Excel and Google Sheets, but be careful when a lower quartile is a worse outcome. So, for example, with the “Percentage decline” figures, Quartile 1 is scored as a “4.”
Built into a dashboard, I get quartile ratings for every post.
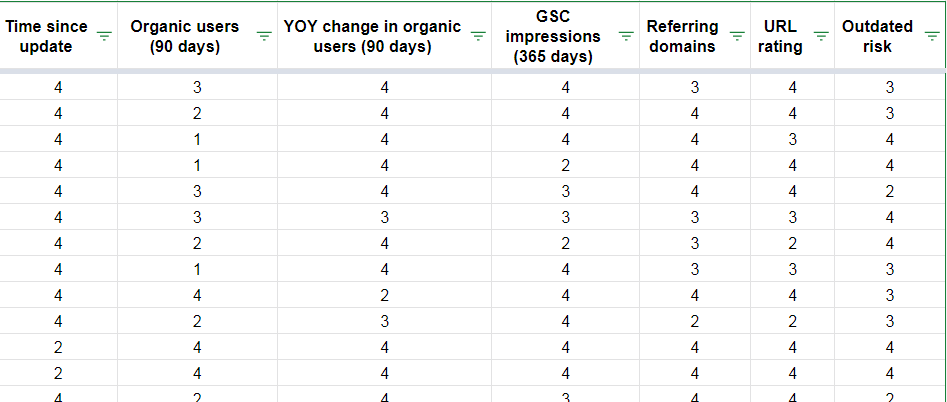
You could simply total the numbers across each row to generate a score. But all metrics aren’t created equal. We settled on a weighting system that emphasizes post age, traffic declines, and a high risk of outdatedness:
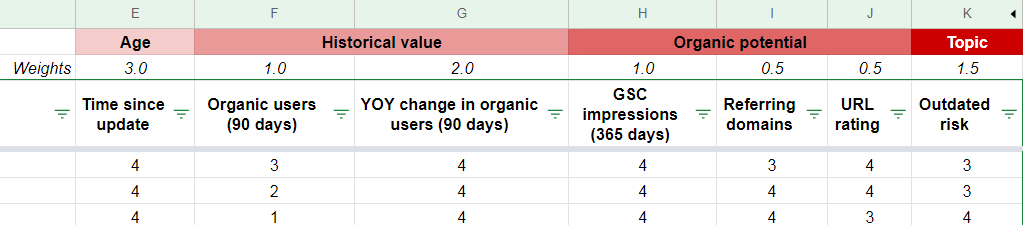
The sheet calculates a total score for each post by multiplying the scores (1–4) by the weights, summing the total for each row, and converting the result to a 100-point scale.
Scores update automatically as new data comes in from Google Analytics, or if there’s a manual update to the publish date. Every morning, we come in and re-sort the sheet to highlight the posts most in need of updates.
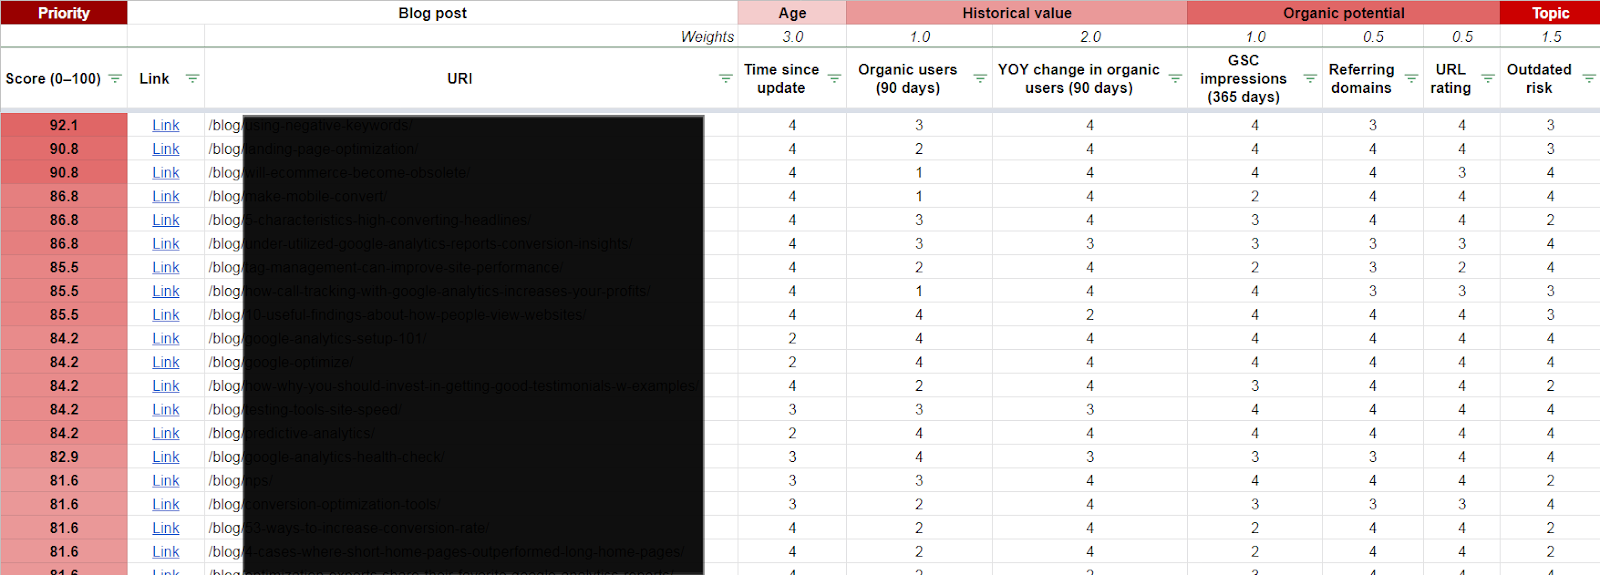
Is it perfect? Of course not. But it’s a pretty efficient way to sift through hundreds or thousands of posts and target those that:
- Really need an update.
- Will deliver the most ROI.
Once you’ve tackled the “M” Mistakes in those posts, you can start thinking about more targeted updates, like formatting changes to win featured snippets.
You may even want to run the analysis below before starting on your core updates—many of these changes are simple to implement while you’re in the document making other updates.
Bonus: How to spot the low-hanging fruit for featured snippets
Your site earns (or doesn’t earn) featured snippets for a variety of reasons. One of those potential reasons is the format of your content.
Say the featured snippet on a SERP grabs a definition for the keyword. But, in your post, that definition is buried halfway down and lacks any structural cues (e.g., a header that asks “What is XYZ?”). Google may fail to surface your snippet, which another site will get.
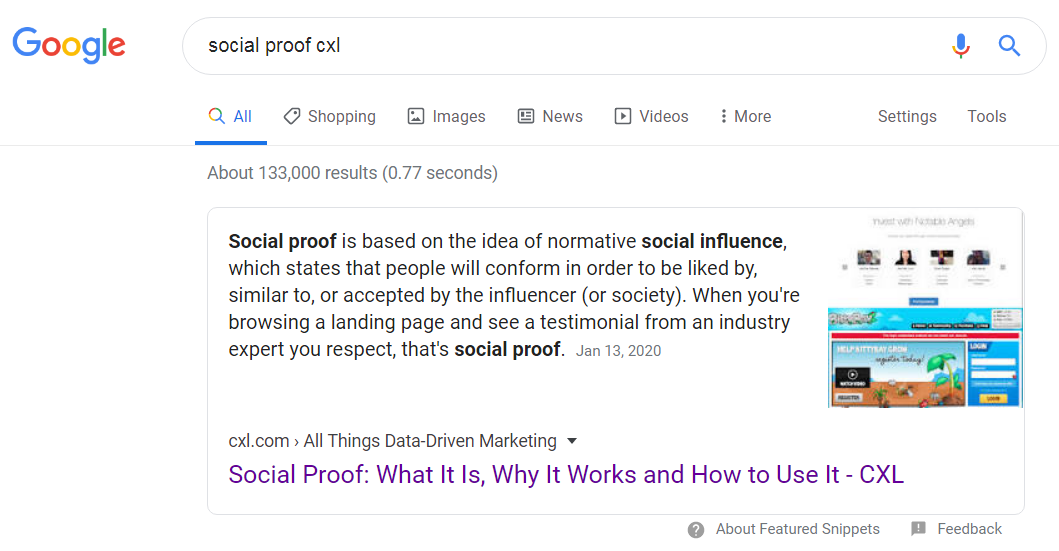
Historically, you could check if Google pulled a snippet for your site with an explicit site search plus the keyword that pulls the featured snippet (e.g., “site:cxl.com social proof”).
If Google returned a snippet, you knew that formatting was unlikely to be the problem. If it didn’t, you had something to work on.
An explicit site search no longer generates featured snippets, but an implicit one does (e.g., “social proof cxl”). So you can still check whether you earn a snippet—manually.
An implicit site search highlights a better way to scale that work. While all keyword tracking tools (to my knowledge) don’t work with search operators, they do, of course, work with brand names appended to the keyword phrase.
Here’s how to scale this process in a tool like Ahrefs.
1. Identify keywords for which you would like to own an existing featured snippet.
You could simply:
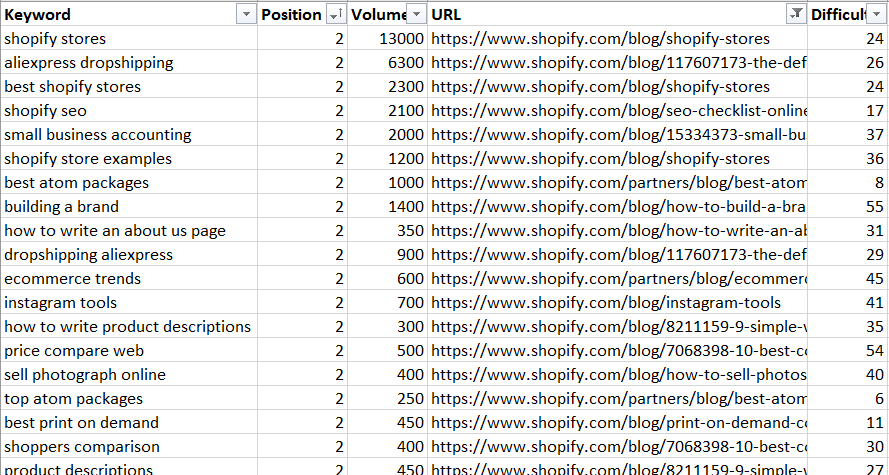
- Go into Site Explorer for your site.
- Navigate to the “Organic keywords” tab.
- Filter for “SERP features” to include “Featured snippet.”
- Filter “Positions” for 2–100 to exclude snippets you already own.
- Export the list.
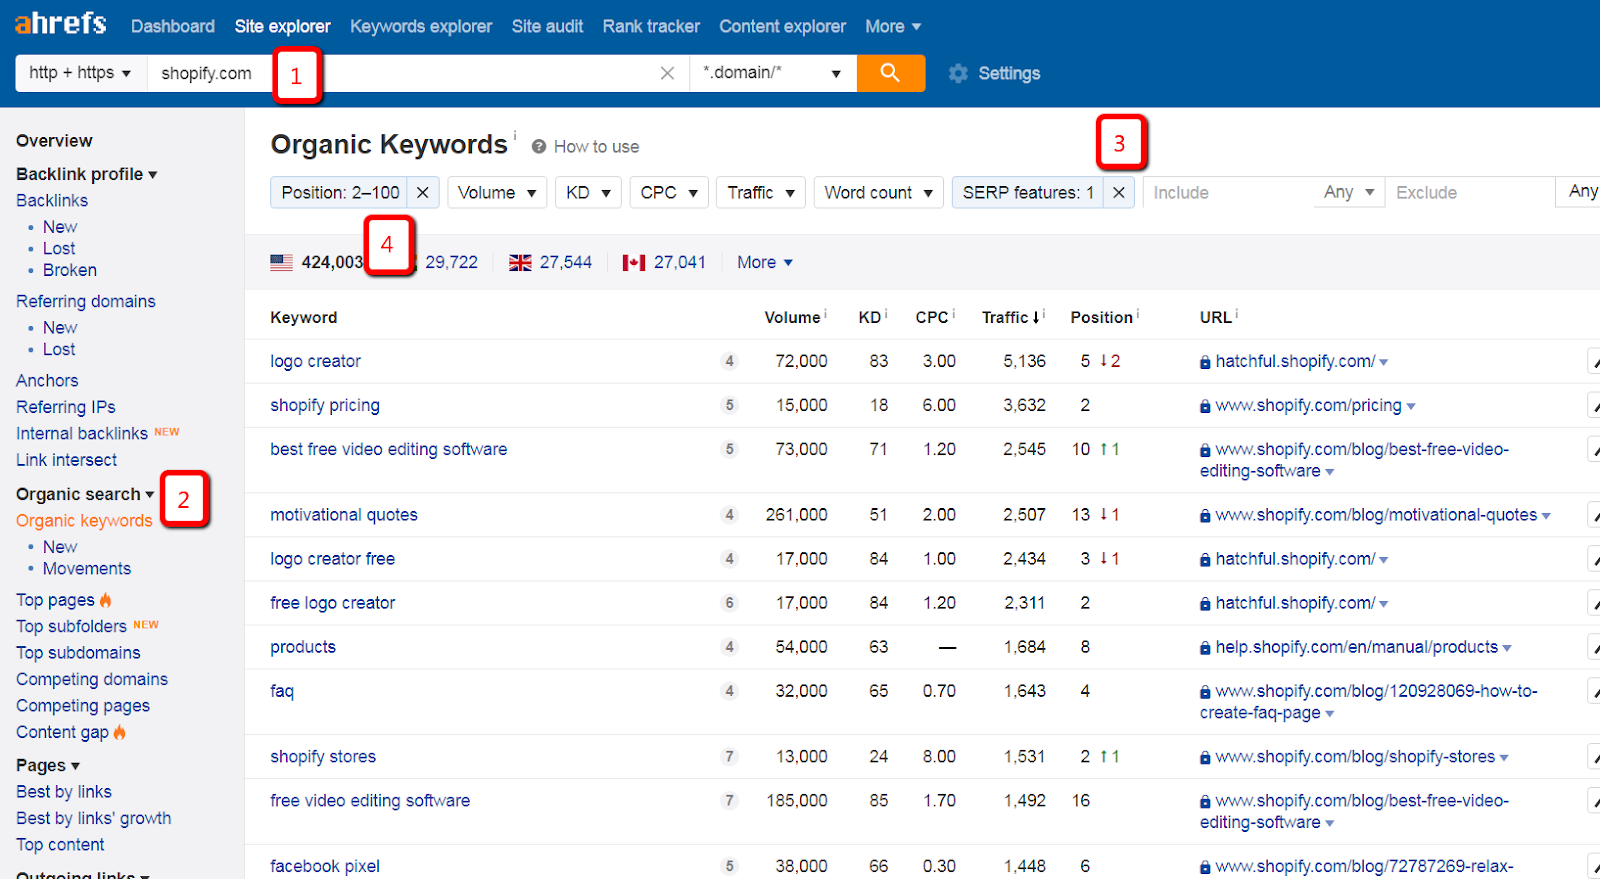
The exported list includes all keywords that return a featured snippet for a site other than your site. If this list includes thousands (or tens of thousands) of keywords, you can:
- Sort by your site’s position;
- Filter by page type (e.g., blog post);
- Export only those keywords for which you rank among the top 10.
2. Append your brand name to those keywords and track them.
Append your brand name to the list of keywords using the =CONCATENATE function:
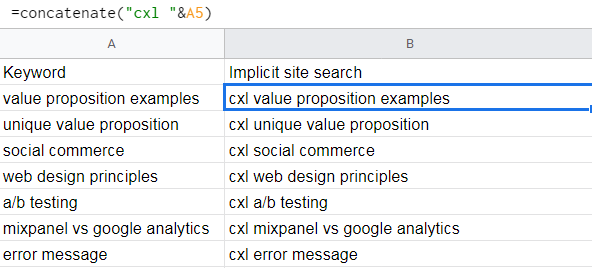
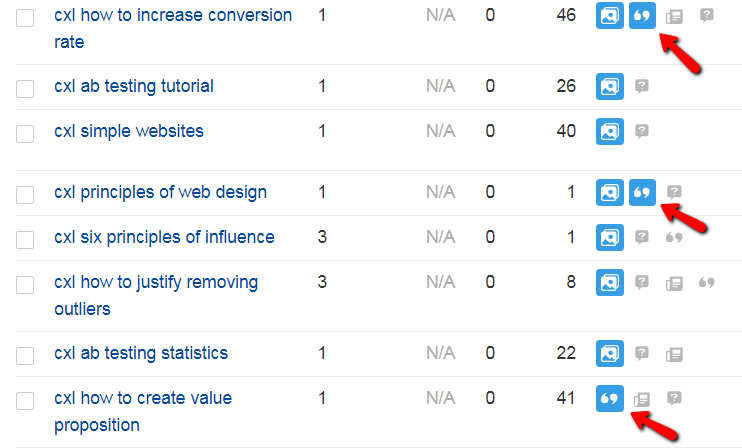
Then, upload the list back into your keyword tracking tool. If the SERP contains a featured snippet for an implicit site search, then formatting is unlikely to be the issue. But if any keyword doesn’t return a featured snippet, formatting may be what’s keeping you from earning it.
3. Test formatting changes and monitor results.
For implicit site searches that don’t surface snippets, investigate formatting issues and test changes. As we’ve found, a simple rewriting of an H2 or bolding of a definition can be the bit of added info that Google needs.
These updates can take seconds to execute while driving hundreds or thousands more visitors to your site. It’s a low-cost way to earn traffic and accommodate mobile users, who want quick answers.
Does any of this actually work?
Hell yeah:
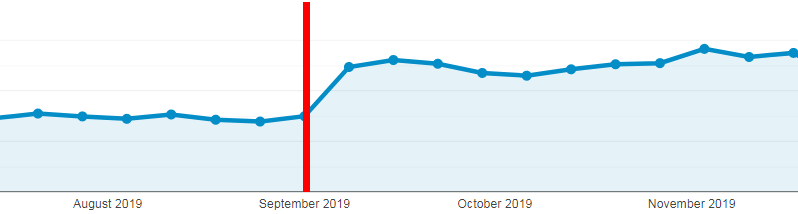
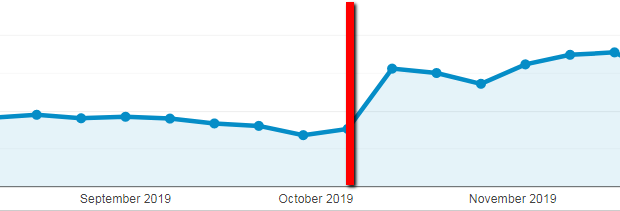
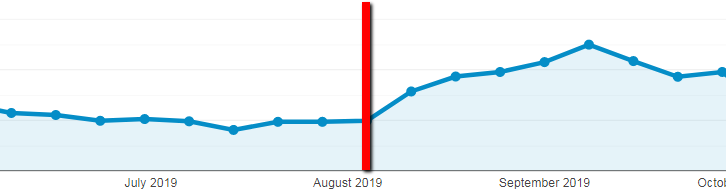
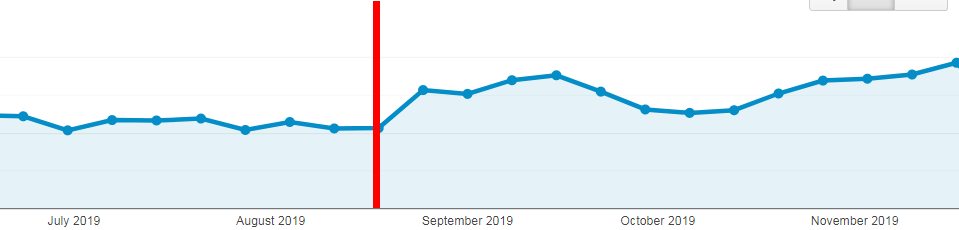
We’ve updated about 100 posts. Not every post has a dramatic rise, but most do. Still, it’s difficult (or, at least, time consuming) to measure the impact of post updates for two reasons.
1. For each post you update, you need to pull the before-and-after period.
Early in our process, we set up relative formulas with the Google Analytics Add-on that, with each passing day, included another day on each side of the update day.
So, for example, if five days had passed since the date of update, the report compared the five days before and after. The next day, it pulled six.
But if you’re updating hundreds of posts over hundreds of days, you’re going to waste a lot of time in the Report Configuration tab.
2. It doesn’t take long before you run into seasonality.
We often lacked near-term visibility into the impact of updates because of how weekends fell. Or, for example, updates made in early January showed exaggerated improvements since the comparison period stretched back into the holiday season.
You can get some validation by checking if Google shows the updated publish date. If it keeps the old one or doesn’t show any date, you didn’t do enough. You could also focus on rankings instead of traffic, as they’re less vulnerable to seasonal shifts.
For the first 19 post updates, I compared time spent and traffic earned for new post creation versus post updates. The results? I could update a post in about one-quarter of the time it took to create a new one and, in the near term, generate 85.2% more traffic than I could with a new post.
There are caveats. Obviously, new posts take a while to rank, so the traffic benefits from a new post take longer to materialize (though the ceiling may be higher). Also, we started by updating the highest value posts—the traffic bump is less for posts that don’t have as much organic potential.
These are reasons why it’s difficult to calculate a caveat-free ROI from this work, but the before-and-after screencaps from Google Analytics are persuasive anecdotal evidence. Plus, it’s what you should be doing anyway—for search traffic, your users, and your brand.
Conclusion
Updating posts gives you more value from stuff you’ve already created. It’s necessary, in part, because potential buyers are more likely to discover your brand from a post you wrote years ago than the one you published last week.
A solid triage process can help you max out the ROI for your efforts, even if it’s difficult to measure the impact precisely.
Once you’ve cleared out the “M” Mistakes, look for opportunities to provide more value—better images, supporting videos, etc.— or reformat content to earn traffic boosters like featured snippets.
Related Posts
-

For companies that build their analytics on Google products, purchasing Google Analytics 360 is a…
-
After reading some subscriber feedback, we noticed that many CXL readers didn't have a solid…
-
For many, Google Analytics 360 is a black box. Marketing and sales collateral from Google…
-
A/B testing tools like Optimizely or VWO make testing easy, and that's about it. They're…


Hi Derek,
Impressive work with many good points in it!
One thing I’d recommend against (strongly) is using the ‘Animalz’s Revive’ tool or any other tool based on the same logic. It simply doesn’t take seasonality into account and has a super high false positive rate. Something like 80% false positives in the top 10 or top 20 pages they identify is not unseen in my experience. This is simply unacceptable as even plain GA can do better than that (0-10% false positive rate with a fairly straightforward report).
Best,
Georgi
Thanks, Georgi, and it’s a fair point regarding the number of false positives, something I struggle to control for, too.
Maybe one of the keyword ranking tools wants to take on this challenge since rankings are insulated from many seasonal changes.
Hi Derek, impressive methodology (and results!). But the “Quartile” concept doesn’t make much sense to me. Would you have a resource to get familiar with it to recommend?
Thanks, Greg!
As far as resources go, there’s tons of stuff out there. I might Google some images of box-and-whisker plots, as they visualize quartiles well. You could also check out some of the slides (starting at Slide 34) from a talk I did last year: https://www.slideshare.net/DistilledSEO/searchlove-boston-2019-derek-gleason-benchmarking-success-for-client-sites-competitors-and-industries
In short, quartiles divide all the data points from any dataset into four buckets (Quartiles 1,2,3, and 4). The median is the dividing line between Quartiles 2 and 3, and one-quarter of all data points fall into each quartile.
The rationale for bothering with quartiles is that our data is far from perfect and often includes outliers. Quartiles keep outliers (actual or those caused by faulty data) from having an undue influence on the scoring system. You can imagine the scenarios: A post that generates tens of thousands of impressions for a term it will never rank for; hundreds of backlinks from low-quality sites that falsely inflate the strength of the page.
At the end of the day, all I really want to know for any given metric is whether a post is “one of the best” (Q4), “better than most” (Q3), “not as good as most” (Q2), or “one of the worst (Q1).
Wow Derek, thanks a lot for your detailed reply. It reminded me of my math classes, but I wasn’t sure why you chose this method in this specific context. Makes perfect sense now :)
Glad it helped. Cheers.
Derek, great post. Thorough and detailed look at the content updating process.
It’s likely best for another post, but once you’ve prioritized your list of articles, how do you evaluate the necessary updates (making longer, more detailed in certain areas, better visuals, internal link updates, etc)? Much of this can involve researching the specific queries for a given keyword to see what is ranking and users “want” from the query, but curious your process and how it potentially mirrors or maps to your research process for new content.
Thanks, Josh.
There is the “M” Mistake vs. “m” mistake consideration, but a lot of it comes down to how many posts you have to update. We have about 700 posts live on the site, which means the backlog of posts that haven’t been touched in years is pretty significant.
Right now, I’m focusing on eliminating the big mistakes (e.g., obviously outdated screenshots, process steps that no longer hold true) and making sure the post aligns with user intent, as well as tidying up via some copy editing.
The long-term plan is to cycle back through posts in a second (then third, then fourth) round to continue to improve them—adding new (or better images), incorporating supporting video content, expanding the number of examples, etc.
For us, we know that—after 700 posts—we’ve covered most of the key topics. At this point, there’s more search (and brand) value in *improving* those core posts rather than pumping out more and more tangential content at the neglect of content that covers topics we should own.