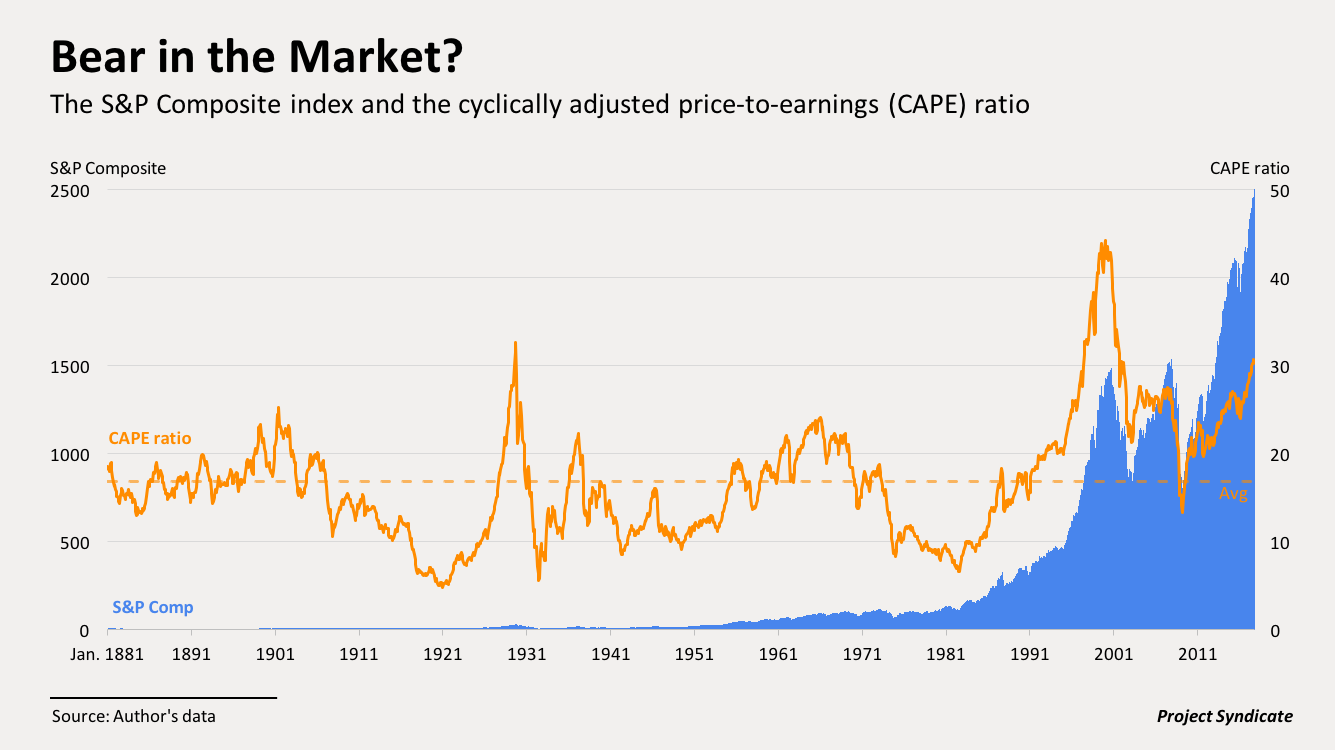

The C.A.P.E. ratio is above 30 today, compared with an average of 16.8 since 1881. It has been above 30 in only two other periods: in 1929, when it reached 33, and between 1997 and 2002, when it soared as high as 44. - Sept 15, 2017 Robert Shiller
Using market data from both estimated (1881 - 1956) and actual (1957 onward) earnings reports from the S&P index, Shiller and Campbell found that the lower the CAPE, the higher the investors' likely return from equities over the following 20 years. The average CAPE value for the 20th century was 15.21; this corresponds to an average annual return over the next 20 years of around 6.6 per cent. CAPE values above this produce corresponding lower returns, and vice versa. In 2014, Shiller expressed concern that the prevailing CAPE of over 25 was "a level that has been surpassed since 1881 in only three previous periods: the years clustered around 1929, 1999 and 2007. Major market drops followed those peaks".
Cape Ratio :
1) A ratio used to gauge whether a stock is undervalued or overvalued by comparing its current market price to its inflation adjusted historical earnings record .
2) it is a variant of the more popular price to earning ratio and is calculated by dividing the current price of a stock by its average inflation adjusted earning over the last 10 years.
3) Using average earnings over the last decade helps to smooth out the impact of business cycles and other events and gives a better picture of a company's sustainable earning power .
4) The ratio was invented by American economist Robert Shiller.
5) It is not intended as an indicator of impending market crashes, although high CAPE values have been associated with such events.
- WIKI
Bob Shiller. Always insightful. - Chad