Understanding Network Effect Strength
Thanks to Harry Stebbings for guilting me into writing more blog posts.
I spent Monday at YC’s demo day. I saw tons of rapid fire pitches. In the majority of them, a founder claimed strong “Network Effects.”
Everyone likes to talk about network effects because they sound so enticing. If a founder can convince investors of network effects, then investors may think they’re buying into a strong company with strong defensibility.
The presentation looks something like this:

The reality is that network effects do exist in many startups, but the strength of those network effects varies greatly depending on the business.
I started thinking about a mental model on how to gauge the relative strength of network effects. Network effects can be gained by:
- * Increased users on demand side
- * Increased users on supply side
- * Increased data
- * Increased connections between users
The increase in users or data or connections plays out by adding value to the user experience in either:
- * Reduced cost
- * Increased liquidity
- * Decreased turnaround time
- * Increased quality
My suggestion is to draw a chart. How does the network effect play out in reality? You don’t even need a ton of data on this, it’s mostly just common sense.
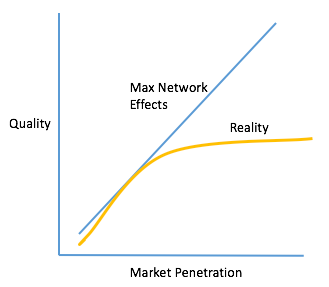
Let’s look at an example. Let’s imagine a marketplace for virtual assistants and just think about how quality might be affected by market penetration. As the business grows from no users to a healthy number, the quality would very likely increase as ratings, feedback, reviews, and breadth of network allow buyers to easily find high quality assistants. However, do you really think quality would keep scaling indefinitely if you went from 100,000 assistants to 200,000 assistants? I’d guess it’s much more likely to level off (and in some cases even go down). It looks something like this:

The network effect strength is measured by how long the quality, cost, and liquidity keep improving with market penetration. If the cost levels off after just 2% market penetration, there’s just not a strong network effect. If it keeps increasing all the way to 100% – then it’s extremely strong.
Similarly, in our virtual assistant example – the cost will not keep dropping as network size increases because there is a minimum wage.
However, if the marketplace can use data, network density, AI, or proprietary tools to fundamentally improve the productivity of the work, then you can see how cost would keep going down with network size.
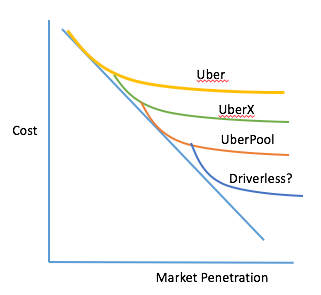
In Uber’s case, they reached a floor on the cost of a single rider on UberX because of wages and gas. The only way to keep the price going down was to introduce UberPool. The next step may be driverless cars.
Uber’s chart looks something like this. The increased market penetration enables them to use new tactics to lower cost. It doesn’t happen automatically with network size, they need to keep introducing new services.

That’s it for now. More to come on how network effects play into liquidity and turnaround time.
campyspod liked this
 jbreinlinger posted this