
Usability testing is one of the most effective ways to uncover issues that users have on your website or app. It works whether you’re a behemoth with millions of users or a startup that’s just left the proverbial garage.
The problem is that usability testing takes time—time to recruit participants, moderate and watch videos, and compile results.
Tools can help with the analysis component, but:
- Tools won’t be useful if you don’t have a good methodology;
- Few tools help you go from data (videos) to insights quickly.
Even after you have your findings, how do you present them in a way to inspire colleagues and bosses to take action? Let’s see how to gain speed and impact with your usability testing reports.
Table of contents
Take notes like a stenographer
Taking notes quickly is the first step to the epiphany. In your note-taking, you’re pursuing three goals:
- Focusing attention on what the participant is doing and saying to spot what’s important;
- Capturing important moments in your notes so you can easily retrieve them later;
- Minimizing the work you need to do after the session is done (if it’s a moderated test) or when you’re finished watching the video (if it’s an unmoderated test).
A technique called data logging uses shortcuts to achieve those goals. Use a letter for each sub-theme you’ll encounter in your study. Here is the one I personally use:
- A for abandonment of a task or action;
- B for bugs;
- F for facial reactions;
- M for miscellaneous remarks;
- N for negative opinions expressed by the participant;
- P for positive opinions expressed by the participant;
- S for suggestions made by the participant;
- U for usability issues encountered by the participant.
When reviewing notes and video clips later, you can enrich each one with a more detailed observation (if needed).
This basic system already achieves the first two goals: capturing important stuff quickly while keeping your attention on the participant. You’ll also have partially achieved the third goal: minimizing the amount of work you need to do at the end of your study for a usable, impactful report.
You can add a second level of categorization at this step. For example, the current task or question could be a theme to add to your note. Thus, 1B would mean a bug occurred during task 1. If, like me, you’re not great at multitasking during moderated tests, you may want to stick with a single level of shortcuts and add themes afterward.
Lastly, keep in mind that each note needs a timestamp so that you can go back to the right moment in the video. That’s especially important for extracting video clips, which we’ll talk about in the next section.
Build a qualitative report from your notes
Once your study is complete and you’ve enriched your notes with timestamps, sub-themes, and themes, your qualitative report is almost ready. Group your notes according to themes and sub-themes, with the relevant video clips included.
At a glance, it’ll be easy to see the main findings while also allowing you to go as granular as you want. Several tools can build this kind of report. If you have a choice, here are things to consider:
- The more integration between your tool and notes, the better. You don’t want to copy-paste dozens of notes.
- The more integration between the tool and video clips, the better. Otherwise, you’ll have to copy-paste the links to the video clips in your report.
- The more shareable, the better. Video clips are usually quite heavy, so it’s easier to share a link. It’s also quite handy to share a link to an individual theme, sub-theme, or note for a specific issue.
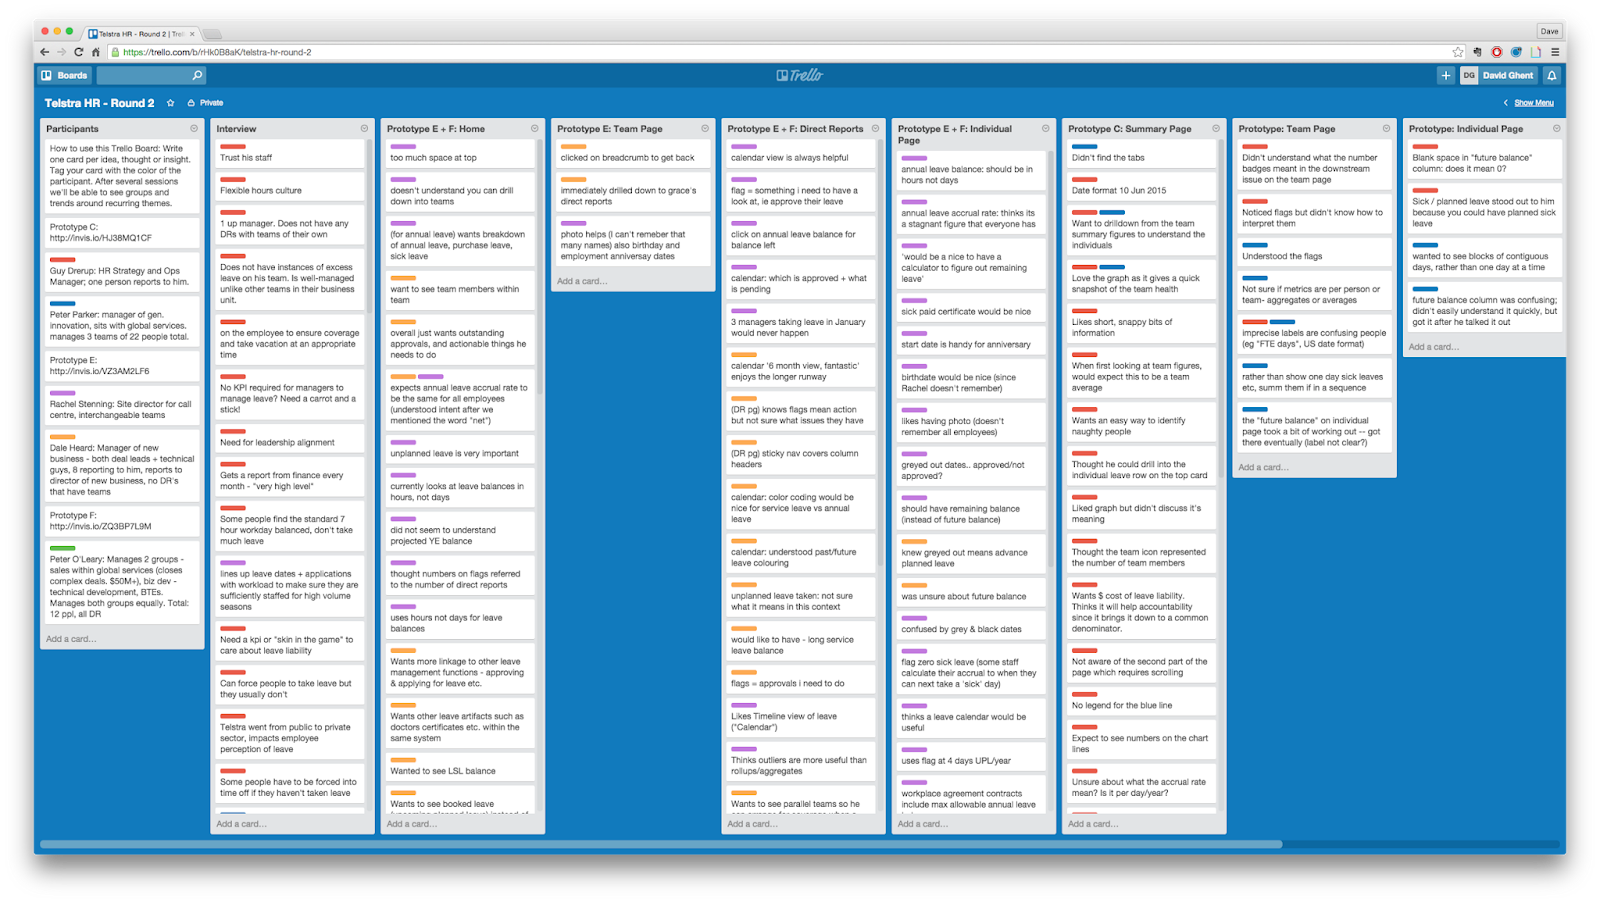
Here’s an example of a qualitative report built with Trello by David Ghent of Pivotal:
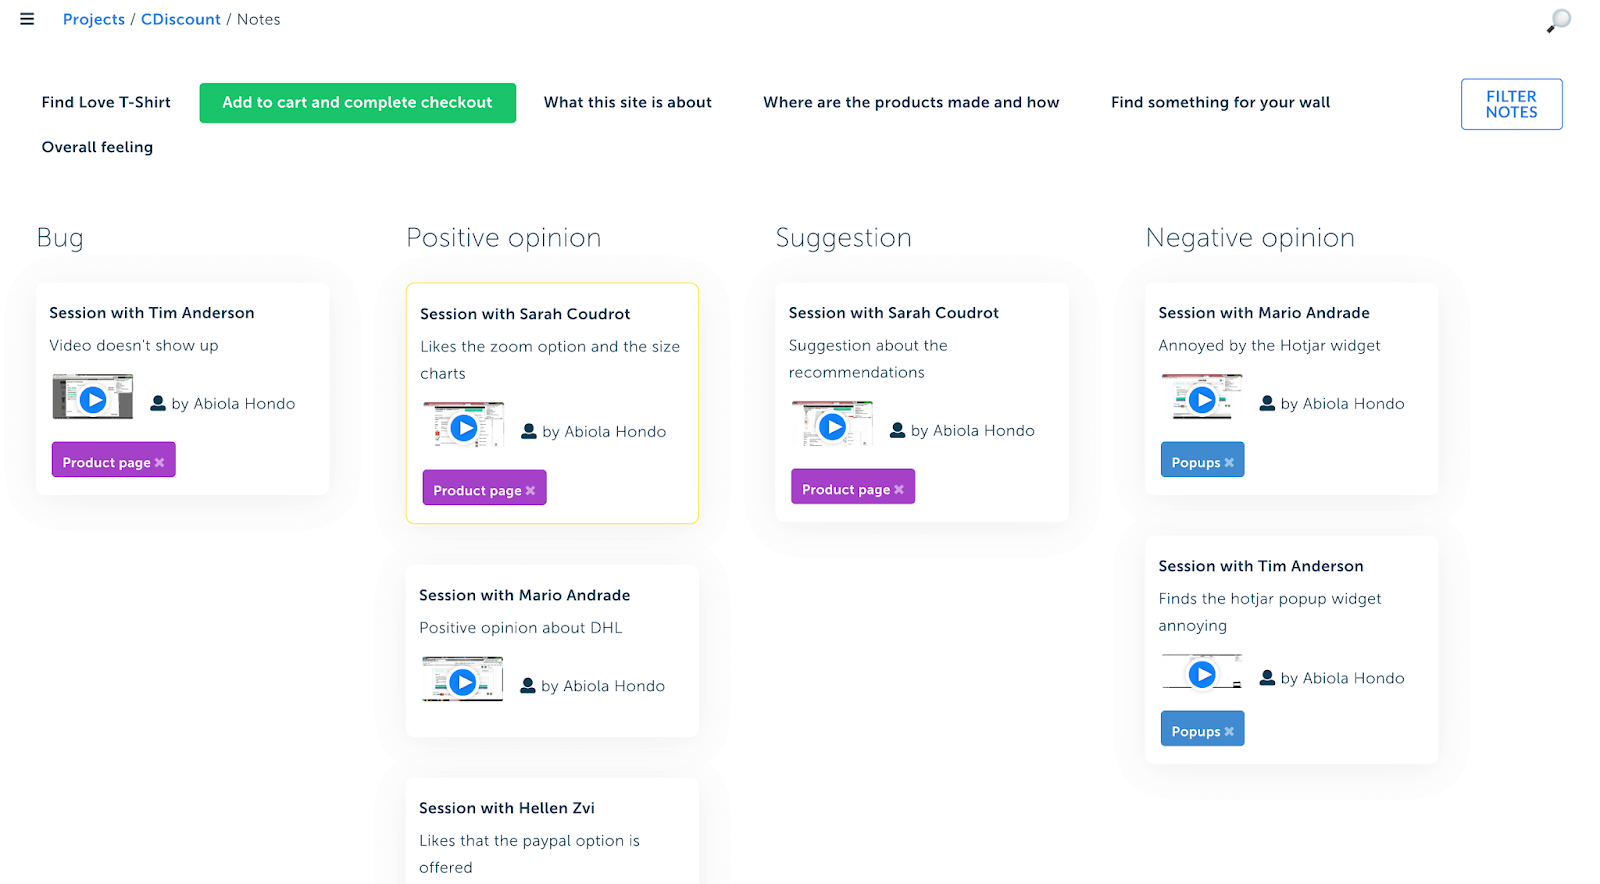
Here’s another one built with Searchness, a tool I’m currently building:
Organizing your qualitative data into a visual report is super helpful to spot issues with your website or app, or to get suggestions and even inspiration for your copywriting. It’s particularly relevant for formative usability testing (i.e. early-stage testing).
The visual report can also triage issues based on attributes like severity and complexity. You can learn more about prioritization from this article by Carl Rosenberg.

The other type of usability testing is summative testing. Summative testing compares core metrics to a benchmark. It could be an industry benchmark, the desired goal for a specific set of metrics, or a comparison with the previous performance of the product.
For summative testing, there are also some efficient techniques and tools to create quantitative reports quickly.
Build a quantitative report from usability tests
First, choose a set of core metrics that are relevant to your project and the recipients of your report. They can be put in two groups:
- System-level metrics.
- Task-level metrics.
Let’s examine each.
System-level metrics
The system usability scale (SUS)
The SUS is a standard technique to measure usability. It has two benefits:
- Reliability. As a standardized survey that has stood the test of time (since 1986), it’s better than your homegrown survey unless you know exactly what you’re doing.
- A bird’s eye view of usability that’s easy to measure, understand, and communicate.
The score is computed from participants’ answers to a set of 10 questions, with each answer ranging from 1 (strongly disagree) to 5 (strongly agree):
1. I think that I would like to use this system frequently.
2. I found the system unnecessarily complex.
3. I thought the system was easy to use.
4. I think that I would need the support of a technical person to be able to use this system.
5. I found the various functions in this system were well integrated.
6. I thought there was too much inconsistency in this system.
7. I would imagine that most people would learn to use this system very quickly.
8. I found the system very cumbersome to use.
9. I felt very confident using the system.
10. I needed to learn a lot of things before I could get going with this system.
You can use a regular survey tool (SurveyMonkey, Typeform, Survicate, Qualtrics) to collect SUS scores from participants. Then, export the results to a spreadsheet to compute the average SUS score using this formula:
- For odd-numbered items, subtract 1 from the participant’s answer.
- For even-numbered items, subtract the participant’s answer from 5.
- Sum the modified answers for each participant and multiply the total by 2.5.
- This will give you a score from 0 (F, or bad) to 100 (A, or good).
- Compute the average SUS score with all participants’ SUS scores.
Many usability testing tools, like TryMyUI, will automate scoring for you:

You can learn more about the SUS score and how to interpret it from Jeff Sauro.
Experience vs. expectation matrix
Another way to get a system-level view of usability is to evaluate the gap between how easy participants expect each task to be and how easy the tasks actually are. To visualize this gap, ask a pre-task single ease question (SEQ) and a post-task SEQ to each participant for each task.
The SEQ asks participants to rate a task on a scale of 1 (very difficult) to 7 (very easy). For any number less than 5, the task is considered “not easy.” It’s usually a way to evaluate task-level usability, but, as David Travis of UserFocus suggests, you can also use it to uncover system-level opportunities and problems.
Compare answers to SEQs asked before the task (participant’s expectation) to the answers asked after the task (participant’s experience). Chart the responses on a scatter plot.
How to analyze the answers
- Easier-than-expected tasks could be a comparative advantage for your product to promote in marketing materials.
- Harder-than-expected tasks should get priority among the list of fixes.
- Tasks that users expected to be difficult and were difficult offer an opportunity to wow users.
- Tasks that participants expected to be easy and were easy should be left alone: They’re doing their job.
Collect participants’ answers using regular survey tools and use a spreadsheet to visualize them. Or, use dedicated tools like TryMyUI or Searchness to do it automatically.
Here is an example of an SEQ report from TryMyUI:
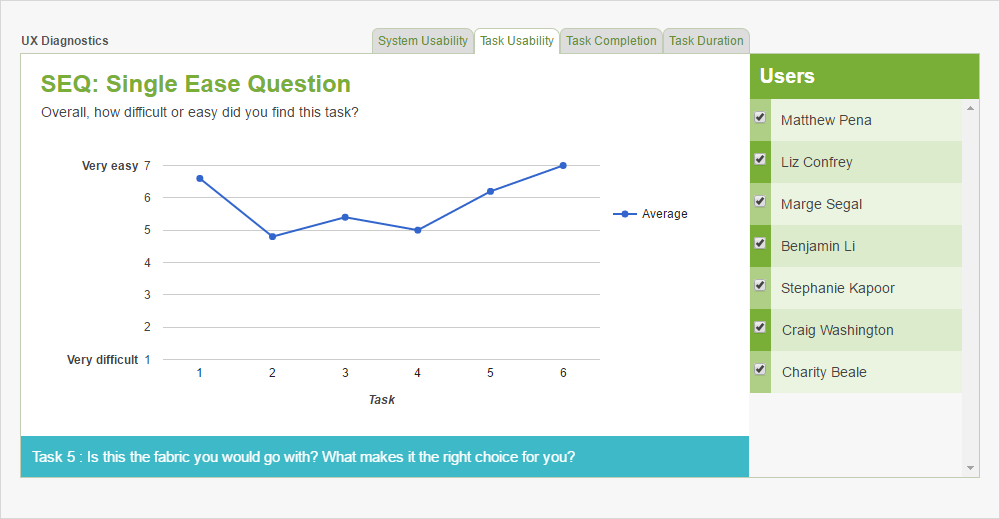
Or, for a different visualization, here’s an example from Searchness:

Task-level metrics
As noted earlier, the SEQ is most often used to evaluate the usability of individual tasks. The biggest disadvantage of this method is that it’s self-reported and thus introduces subjectivity. A study by Jeff Sauro and Jim Lewis found that, astonishingly, 14% of participants who failed a task still reported the task as being easy!
Let’s explore other common metrics for individual tasks that can be measured with less subjectivity.
Completion and failure rates
There are three types of completion rates:
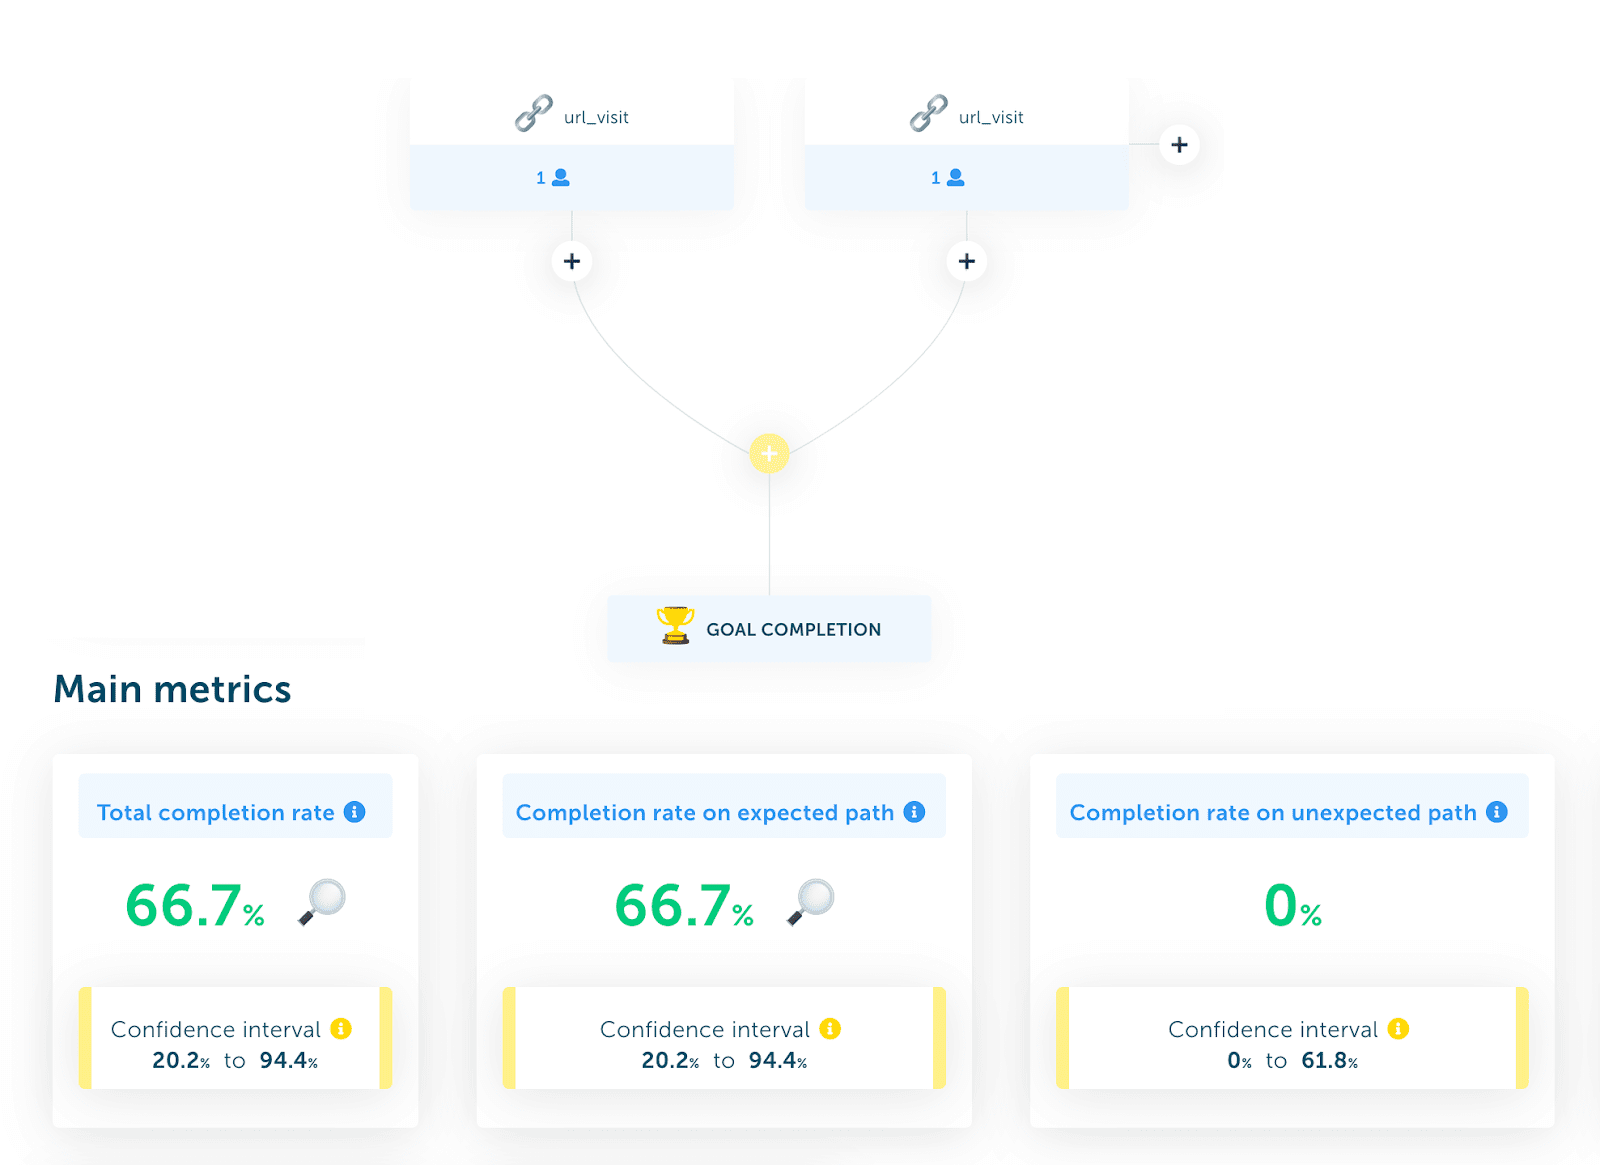
- Total completion rate. The most common type, it’s the percentage of participants who complete a task, no matter how.
- Completion rate on an expected path. The percentage of participants who complete a task by following the path you expect them to follow.
- Completion rate on an unexpected path. The percentage of participants who complete a task using steps that you didn’t expect or know about. This is a great way to uncover usability issues or opportunities. (We get few insights from watching people follow an expected path—insights usually come from what surprises us.)
Trying to define your steps on paper, watch the recordings, and compute everything manually is tedious. Several tools allow you to define expected steps or paths for task completion and get those metrics automatically.
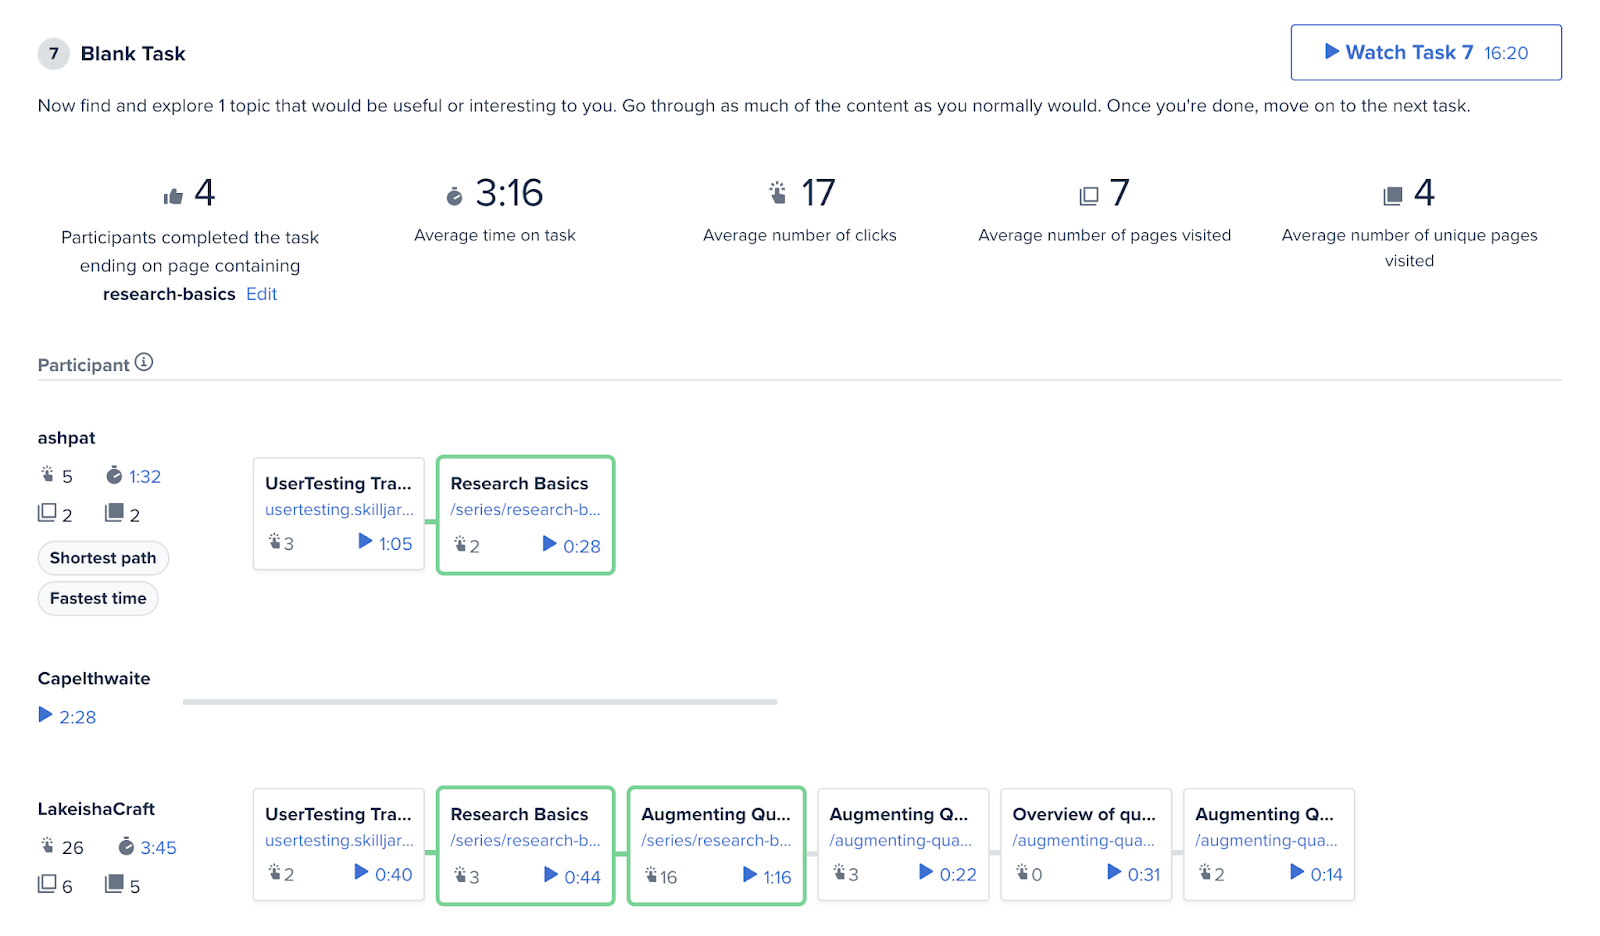
For example, with UserTesting.com, you use a feature called click paths:
With Maze, a tool focused on usability testing for prototypes, you get a report like this one:
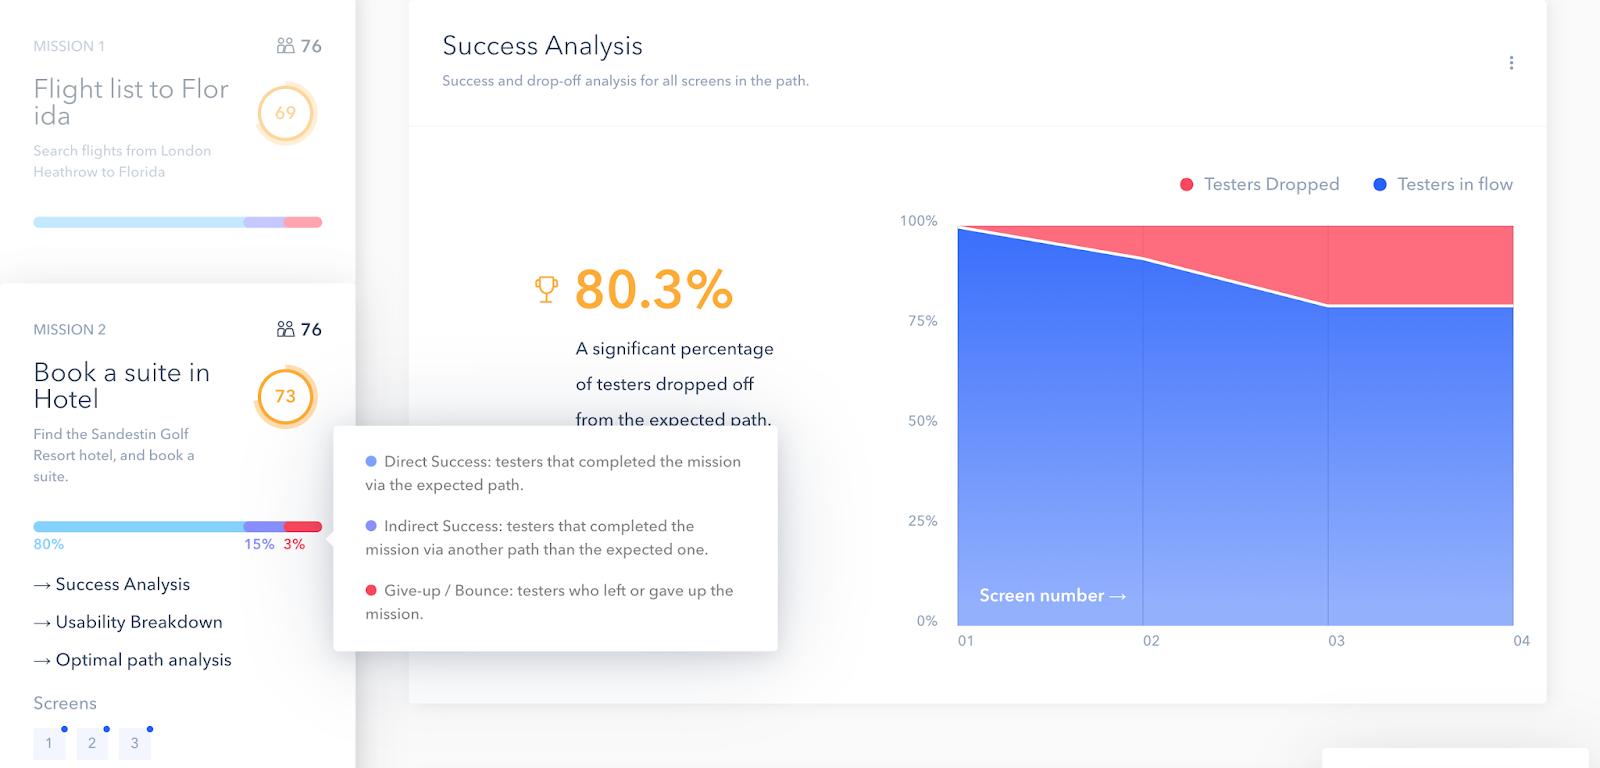
In Searchness, you define steps visually to get the metrics:
The inverse of the completion rate is your failure rate. Look at the failure rate at each step of your expected paths to understand where people struggle most. That’s something you can do automatically with the tools above.
Lostness
Finding the percentage of people who complete a task is one thing. But how do you know if it was easy for them? SEQs can be quite subjective. Lostness measures how lost a participant was during a task.
Devised by Patricia Smith in 1996, the metric takes into account the minimum number of pages required to complete a task, then compares it to the number of pages actually visited by the participant.
The outcome is a score between 0 and 1. The closer the score is to 1, the more lost the participant was (and vice versa). A participant is considered lost if the score is 0.4 or higher.
The exact formula looks somewhat obscure:

- L is the lostness score.
- N is the number of unique pages visited.
- S is the total number of pages visited (including multiple visits to the same page).
- R is the minimum number of pages needed to complete the task successfully.
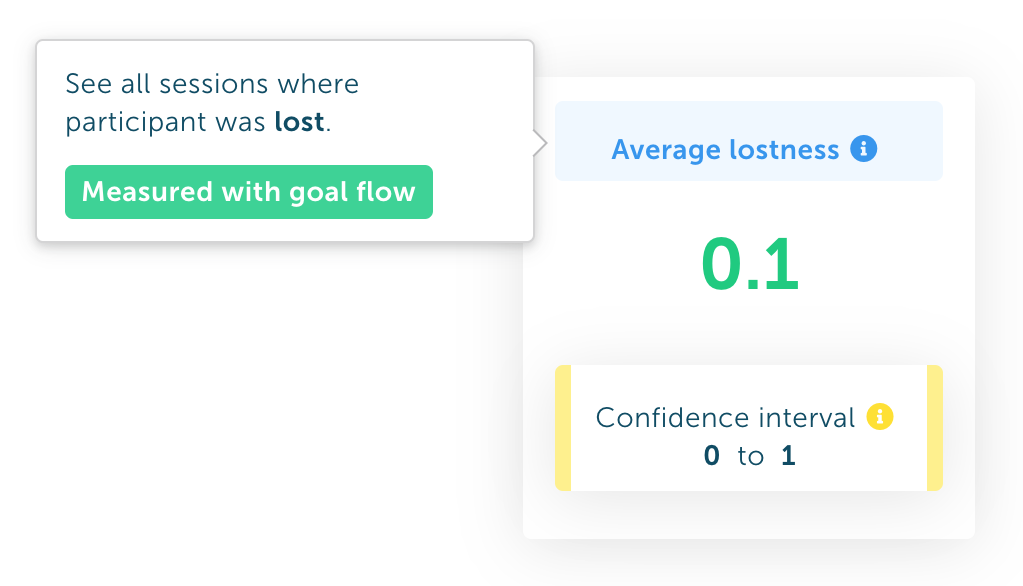
You can compute it manually, but, as with similar tasks, it’s laborious. A few tools can automate it, including Loop11 and Searchness.
Duration time
The last must-have task-level metric is the average duration time for each task. Most remote usability testing tools measure it for you. One note of caution: Duration time can be skewed by a few ultra-slow participants.
Those slowpokes can have a large impact on duration time if it’s calculated (naively) using the arithmetic mean. For small samples (≤25), it’s best to use the geometric mean. For larger samples (>25), the median is a better way to compute it. Make sure you know how your tool does it before communicating the results.
Some words about confidence intervals
Once you have your metrics, are you ready to put them in a report and share it with your organization? Not quite yet. With usability testing, we don’t have as much data as we might get from analytics, but that doesn’t mean we can’t conduct a rigorous statistical analysis.
Usability testing (hopefully) works with a representative sample of our target population. Still, it’s only a sample. How can we be sure that completion rates observed for 20 participants will be the same for 20,000 users?
Even with small sample sizes, we can account for this uncertainty with confidence intervals. For any metric, the confidence interval (typically 95%) is “an estimated range of values which is likely to include an unknown population parameter, the estimated range being calculated from a given set of sample data.”
For example, let’s say we measured a lostness score of 0.1 during our 25-person usability test. With a lostness confidence interval between 0.0 and 0.3, we can say that—if we were to measure our entire target population—the lostness score would likely be within that interval.
If our sample size is too small, however, we’ll end up with a large interval—one that may even include the entire range of outcomes:
For usability testing, there are four cases to consider for confidence intervals:
- Completion rates;
- Survey scores like SUS and SEQs;
- Duration time for small sample sizes (≤25);
- Duration time for large sample sizes (>25).
The quickest and easiest way to obtain confidence intervals is with a tool that does it for you. If you want to compute confidence intervals manually (or simply understand more about the calculation), you can get all the details from this book.
Confidence intervals are good for you. Use them!
Report for impact
When you share your findings, you need a selective memory—in a good way, for a good cause. Show only the results that people care about and inspire action. Different people care about different things, but everyone cares about the stuff that can improve their personal bottom line.
For the C-Suite, you may need to focus on quantitative metrics and benchmarks that offer the big picture and help make big decisions, like hiring more UX folks to catch up with the competition.
If you’re trying to make your numbers clear and interesting, a great resource is Stephanie Evergreen’s Effective Data Visualization. (CXL Institute also has a course on data presentation.)
With product teams, you may want to focus on your qualitative data, especially video clips and participant quotes that demonstrate tangible issues to prioritize for upcoming development sprints.
In my experience, the best way to make people take an issue seriously is to deliver an oral presentation with several video clips that show multiple participants struggling with the same problem over and over again.
If you need some inspiration, Usability.gov has some templates to get you started:
Finally, keep in mind this famous Saint-Exépury quote: “Perfection is achieved not when there is nothing more to add, but when there is nothing left to take away.” Practically speaking, try to limit all presentations to the top five findings. Put everything else in an appendix.
Conclusion
Part of the value of usability testing depends on how quickly you translate tests into persuasive data. Tools can help expedite the process, but knowing how those tools fit into your process is essential:
- Use data logging to speed up note-taking.
- Keep notes and links handy and shareable for your qualitative reports.
- Automate system- and task-level metric calculations to build quantitative reports efficiently.
- Segment your audience and deliver concise, tailored presentations that inspire action.
If your testing program isn’t hitting any of these marks yet, try adding one technique or tool for the next round.
Related Posts
-

Usability testing is the black horse of boosting conversions. If your site is difficult to…
-
Usability testing is important, but when you're juggling tons of other tasks - acquisition, hiring,…
-
Symbolism is a tricky thing. Different symbols mean different things to different people based on…
-

Are you taking time to think, just think? Dedicated time for thinking is the key…