
Propensity modeling lets us look at what people are likely to do—in the future.
My interest is in the future because I am going to spend the rest of my life there.
C.F. Kettering
When we look at data and analytics, we’re focused on the past. How did we do last quarter? What happened H1 2019? And how does that compare to H1 2018? How well did landing pages X, Y, and Z convert last Monday at 1:03 p.m.? (I’m kidding, I’m kidding.)
Data becomes more valuable when we use it to predict the future instead of just analyzing the past. That’s where propensity modeling comes in.
Table of contents
What is propensity modeling?
Propensity modeling is a statistical approach that attempts to predict the likelihood that visitors, leads, and customers will perform certain actions.
It’s a statistical technique that accounts for all the independent and confounding variables that affect customer behavior.
What does propensity mean?
Oxford English Dictionary defines propensity as a tendency to a particular kind of behavior. For example, a CrossFit lover might have a propensity for drinking protein shakes.
So what does a propensity model do?
Propensity modeling gives you a propensity score, which is the probability that a visitor, lead, or customer will perform a certain action.
So, for example, a propensity model can help a marketing team predict, through data science or machine learning, the likelihood that a lead will convert to a customer. Or that a customer will churn. Or even that an email recipient will unsubscribe.
Why optimizers should care about propensity modeling
Even if you’re not currently using or considering propensity modeling, understanding the mathematics behind the process is important. For example, do you know the difference between linear and logistic regression models?
The same way SEO experts need to understand a bit of content marketing and HTML to be competent, optimizers need a basic understanding of statistics and propensity models.
But why should optimizers care about propensity modeling when there’s testing and experimentation?
Tim Royston-Webb, CEO of SentryBay, offers a few reasons:
The thing is that we can’t always rely on these statistical methods in the real world. There might be several scenarios where real experiments are not possible:
Tim Royston-Webb
- sometimes management may be unwilling to risk short-term revenue losses by assigning sales to random customers.
- a sales team earning commission-based bonuses may rebel against the randomization of leads.
- real-world experiments may be impractical and costly in certain cases when the same data or participants can be modeled through quasi-experimental procedures or when historical data is enough to produce actionable insights.
- real-world experiments may involve ethical or health issues, for example, studying the effect of certain chemicals.
Propensity modeling vs experimentation: one or the other?
Propensity modeling and experimentation are not mutually exclusive. The two work best when combined—when a propensity model fuels an experimentation program and vice versa.
Even if you don’t face any of the experimentation challenges that Royston-Webb mentions, propensity modeling can help you:
- Fill your pipeline;
- Save time on quantitative conversion research;
- Explore smarter segmentation options.
How to build a customer propensity model
Not all propensity models are created equal.
As Mojan Hamed, Data Scientist at Shopify, explains, there’s no shortage of options to choose from, and none are inherently superior:
The first step is to actually pick a model because you have a few options. For example, instead of measuring propensity to churn, you could choose a survival analysis.
Regression is a good option because it’s very interpretable for non-technical audiences, which means it can be communicated easily.
It’s also less of a black box, making the risk more manageable. If something goes wrong and accuracy is low or you get an unexpected result, it’s easy to drill down to the formula and figure out how to fix it.
Mojan Hamed
For example, if you’re forecasting and notice some segments do well with the base models while others do not, you can dig deeper into those low-accuracy segments to identify the issue. With regression, the whole process won’t take more than a few minutes. With other models, that diagnosis is more time-consuming and complex.
Once you’ve selected the model that’s right for you (in this article, we’ll focus on regression), building it out has three steps:
- Selecting your features;
- Constructing your propensity model;
- Calculating your propensity scores.
Edwin Chen, CEO and Engineering and Research lead at Surge AI, summarizes the process in more detail:
First, select which variables to use as features. (e.g., what foods people eat, when they sleep, where they live, etc.)
Next, build a probabilistic model (say, a logistic regression) based on these variables to predict whether a user will start drinking Soylent or not. For example, our training set might consist of a set of people, some of whom ordered Soylent in the first week of March 2014, and we would train the classifier to model which users become the Soylent users.
The model’s probabilistic estimate that a user will start drinking Soylent is called a propensity score.
Form some number of buckets, say 10 buckets in total (one bucket covers users with a 0.0 – 0.1 propensity to take the drink, a second bucket covers users with a 0.1 – 0.2 propensity, and so on), and place people into each one.Finally, compare the drinkers and non-drinkers within each bucket (say, by measuring their subsequent physical activity, weight, or whatever measure of health) to estimate Soylent’s causal effect.
Edwin Chen
Let’s explore each step further.
1. Selecting the features for your propensity model
First, you need to choose the features for your propensity model. For example, you might consider:
- Product milestones;
- App and theme downloads;
- Demographics;
- Device usage;
- Buying history;
- Plan selection.
Your imagination is the only limit.
Selecting features is easier when you’re interested only in a prediction. You can just add all the features you’re aware of. The less relevant the feature, the closer the coefficient will be to 0. If you’re interested in understanding the factors of that prediction, it becomes more difficult.
As Hamed explains, there are a few checks and balances:
Let’s say when you train the model, you train it on 50% of your historical data and test it on the remaining 50%. In other words, you hide the variable you’re trying to predict from the model in the test group and try to get the model to predict the value—so you can see how well you can predict something that you already have actuals for.
If you want to interpret coefficients, you have to ensure the error (the actual value, what you predicted) has no correlation to the variable you’re trying to predict. If it does, that means that there’s a trend in the data set that you’re not capturing in your features. It’s a good sign that you have a variable you should be including that you’re not already.
Also, make sure two features aren’t linearly correlated to each other. That’d be a good use case to remove a feature.
Mojan Hamed
Whether you’re interested in interpreting the coefficients or not, one thing is certain: You’ll need to gather insight from internal experts. Despite popular belief, propensity modeling does not diminish the need for business and marketing know-how.
So, gather a room full of domain experts: email marketers, conversion optimizers, data scientists, finance experts, CRM specialists—anyone with relevant business acumen.
There are numerous mathematical ways to decide which features to select, but they can’t replace human knowledge and experience.
2. Constructing your propensity model
Regression has been mentioned a few times already. But what exactly is regression analysis? It’s a predictive modeling technique that examines the relationship between a dependent variable (e.g. lead-to-customer conversion) and independent variables (e.g. product milestones, app and theme downloads, etc.)
Jim Frost, founder of Statistics by Jim, explains:
In regression analysis, the coefficients in the regression equation are estimates of the actual population parameters. We want these coefficient estimates to be the best possible estimates!
Suppose you request an estimate—say for the cost of a service that you are considering. How would you define a reasonable estimate?The estimates should tend to be right on target. They should not be systematically too high or too low. In other words, they should be unbiased or correct on average.
Recognizing that estimates are almost never exactly correct, you want to minimize the discrepancy between the estimated value and actual value. Large differences are bad!
These two properties are exactly what we need for our coefficient estimates!
Jim Frost
For the purposes of this article, you’ll want to be familiar with linear and logistic regression.
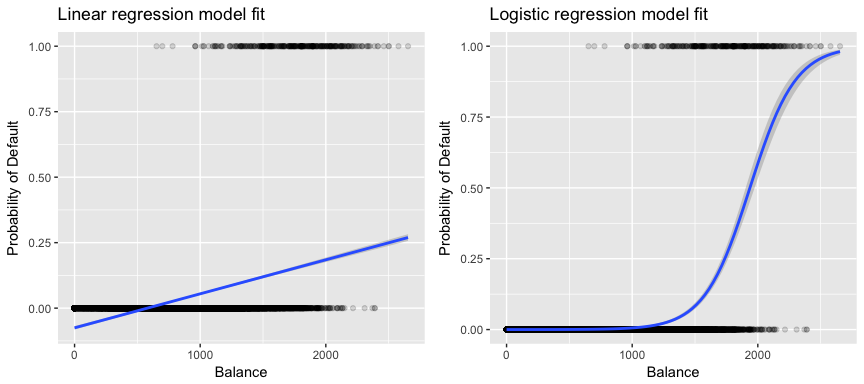
In linear regression, the outcome is continuous, meaning it can have an infinite number of potential values. It’s ideal for weight, number of hours, etc. In logistic regression, the outcome has a limited number of potential values. It’s ideal for yes/no, 1st/2nd/3rd, etc.
3. Calculating your propensity scores
After constructing your propensity model, train it using a data set before you calculate propensity scores. How you train the propensity model and calculate propensity scores depends on whether you chose linear or logistic regression.
Hamed explains:
In a linear regression model, it literally multiplies the coefficients by the values and gives you a continuous number. So, if your formula is
customer_value=0.323(sessions per month), where0.323is the coefficient for your sessions per month, it multiplies the number of sessions you had that month by 0.323.For logistic regression, the predicted value gives you a log-odds and the calculation can convert it to a probability. This probability is what we interpret as the “score.”
Mojan Hamed
It’s important that the propensity model works with your real-world data. This is a perfect example of how propensity modeling and experimentation go hand-in-hand. Experimentation can validate the accuracy of propensity scores.
No matter how confident you are about the accuracy, run an experiment. There could be factors you haven’t considered. Or, for example, the model may unexpectedly optimize for quantity (e.g. session-to-lead conversion rate) without considering the impact on quality (e.g. lead-to-customer conversion rate, retention, etc.)
The use of experimentation to validate propensity modeling is critical. It gives you peace of mind.
Again, propensity modeling is a tool at an optimizer’s disposal, not a replacement for a thorough understanding of experimentation and optimization. Take advantage of how open regression is—look under the hood and ensure the data you’re seeing makes sense before running wild with it.
How to use your propensity model for smarter experimentation
I know, I know. You don’t need another lecture on how correlation is not causation. But, with propensity models, it’s easy to see causation where it doesn’t exist.
In a regression model, you can’t assume features have a causal relationship with the variable you’re attempting to predict.
It’s easy to look at the model and see, for example, that downloading X apps during a trial is a good indication that the lead will convert into customer. But there’s absolutely no proof that driving more app downloads during a trial will make anyone more likely to convert into customer.
Another important word of caution: Don’t substitute propensity scores for your (very valuable) optimization knowledge.
Propensity modeling, like other tools, will not tell you how to optimize. When you open up Google Analytics or fire up an Adobe Analytics dashboard, the insights don’t fall off the screen and into your lap. You use your experience, knowledge, and intuition to dig for those insights.
For example, you might know that a customer is highly likely to churn thanks to your propensity model. But is the value of what you spend preventing that churn higher than the lifetime value of that customer? Your model can’t answer that question—it’s not a replacement for critical thinking.

The 3 most valuable propensity models for optimizers
Alright. As we gently step over all of that caution tape, let’s look at three valuable propensity models optimizers can leverage:
- Propensity to buy or convert. How likely are visitors, leads, and customers to make a purchase or convert to the next step of the funnel? Those who have a lower propensity score need more incentives than others (e.g. you might offer a higher discount if you’re an ecommerce store).
- Propensity to unsubscribe. How likely are recipients, leads, and customers to unsubscribe from your email lists? To those with a higher propensity score, you might try reducing the frequency of emails or sending a special offer to reinforce the value of remaining a subscriber.
- Propensity to churn. Who are your at-risk leads and customers? If they have a high propensity score, you might experiment with in-product win-back campaigns or assign account concierges to reconnect them with your core value proposition.
Propensity modeling is not prescriptive. Knowing that a group of leads has a higher propensity to convert alone is not particularly valuable. What’s valuable is combining that knowledge with optimization know-how to run smarter, more targeted experiments and extract transferable insights.
Conclusion
The future is not an exact science. (Arguably, exact science is not an exact science.) But you can predict the future with a reasonable degree of certainty with propensity modeling. All you need is a rigorous process and a data scientist.
Here’s the step-by-step process:
- Select your features with a group of domain experts. Carefully consider whether you want to interpret the coefficients or not.
- After choosing linear or logistic regression, construct your model.
- Train your model using a data set and calculate your propensity scores.
- Use experimentation to verify the accuracy of your propensity scores.
- Combine propensity modeling with your optimization expertise to run smarter, more targeted experiments that lead to more valuable, more transferable insights.
You’ll be able to push your data beyond what has already happened and toward what is probably going to happen in the future.
Working on something related to this? Post a comment in the CXL community!
Related Posts
-

Design impacts behavior. If you know how to impact behavior, you can design for behavior.…
-

You have your CRM, web analytics, email marketing tool, payment processors, survey tools and so…
-
Do you need to be a big company and need large volumes of traffic to be data…
-
You’ve worked all quarter on a new content marketing series and conversions are ticking upwards.…