The Bloomberg Startup Barometer
I came across this index from Bloomberg that tracks the health of the US startup ecosystem.
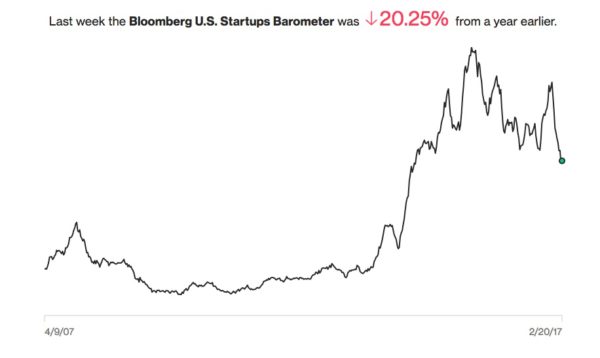
This index “incorporates both the money flowing into VC-backed startups, as well as the exits that are making money for investors. To smooth out some of the volatility, we calculated the average value for the last 12 weeks.”
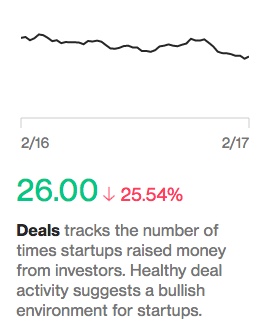
I like that they are tracking both inflows (investments) and outflows (exits). What’s interesting is that over the past year, the exit chart is looking better than the investment chart:
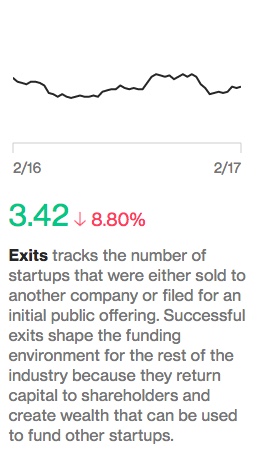
If exits continue to outpace investments, that’s a very bullish thing for the startup sector, particularly for investors. But what is good for investors is ultimately good for founders because strong performance will lead to more capital flowing into the sector.
This chart is investments since 2007:
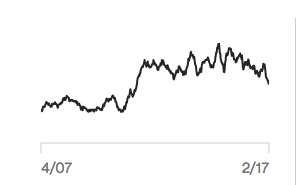
You can see that the VC sector ramped its investing activity significantly in 2010 & 2011 and has maintained it at roughly those levels (with some tailoff recently) since then.
This chart is exits since 2007:
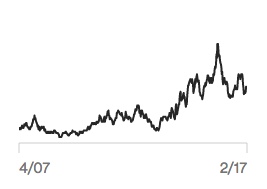
You can see that exits did not start increasing until 2014, roughly three to four years after the significant pickup in investment pace. That makes sense because of the “gestation period” of startups is at least four years and in most cases longer.
I will be keeping my eye on this new index from time to time. And I will be most interested in the shape of the exit chart because it is the strongest predictor of the long term health of the startup ecosystem.
Comments (Archived):
I hadn’t seen this, thanks for sharing. My one question would be: isn’t the rise of massive private companies due to JOBS act (Uber, airbnb, etc.) underrepresented in this index? While the inflow of their investment is substantial, in past cycles they would’ve long been public and I’d think the large exit would carry more weight than an inflow.
More public exits needed in 2017.
Snap IPO, impact on Venice California.https://www.nytimes.com/201…Venice experiencing their Joni Mitchell moment:Snap has already changed the face of Venice, a once bohemian beachside section of Greater Los Angeles. When Mr. Spiegel and Mr. Murphy moved Snap to the area in 2013, they put the company in a single beach bungalow near the Venice Beach boardwalk.Pricing of RE will inflate even beyond the ordinary increase in demand or new wealth (part of it is psychology of buyers and sellers):To capture some of these soon-to-be wealthy techies, Los Angeles real estate agents, lawyers and wealth managers have bought targeted search and Facebook ads, they said. Others are trying to spread word of their services through their networks of contacts. Tech employees are feeling the effects — some said they had been bombarded with LinkedIn messages from companies that find clients for these service providers. “It will be amazing to see the tech industry take off,” said Lee LeGrande, a residential real estate agent at LeGrande Beach Homes, which sells property in Manhattan Beach and Hermosa Beach. In anticipation of new money from Snap workers and Silicon Valley techies, he said, he is building some luxury beach homes.
I was in LA’s “Silicon Beach” last year. My Mum’s best friend from junior school invited me to stay with her in LA.There was about 20 blocks of new luxury condos between the Marina and where YouTube’s offices are. They’re about $1.3 million for 2 bedrooms.
Have you seen this?http://snap.netroadshow.com…The partner video is provocative: geo targeting tools, focus on entertainment, native phone experience (vertical everywhere).$22B seems like the end point for them valuation-wise, not the beginning, fwiw. Young people buying clothes and entertainment is huge, obviously.But who uses it when they are married w 2.4 kids?
My stepkids are using this 24×7. But then again they were into Minecraft last year and haven’t used it since. The target market for this (as far as I know and I am not an expert or close on snapchat) is a moving target. I can absolutely see the age group that is the core of snapchat moving to something else. That’s in addition to growing out of it. Both the pictures and the concept is ephemeral, right?How did we get to the point where so much money and talent is being used and wasted to rearrange the deck chairs of the advertising business???? That essentially cannibalizes other entertainment?I started to watch the video ‘Snap is a Camera Company’. What a great distraction that allows investors to rationalize their gamble on this.This should be video of the week. I will be able to take more potshots at it and then see how some greater fools actually make money buying the stock and how I was wrong.
Advertising is a real business of course, but the deck chairs comment is a good one.I can imagine a complete strangle hold on 12-24 year old market, even globally, being worth $200B, I guess. But that seems priced for perfection.
I don’t know, but Snap seems to be trying too hard at the sell. Is this a Zynga?
Very well could be a Zynga. You should read their prospectus. Majority of Snap users are 18-34, with a heavy under 25 skew (and more likely even younger, although the prospectus doesn’t drill that deep). Their risk assesment doesn’t acknowledge “the fickle nature of youth and/or the age groups historic attachment to fleeting trends,” but the prospectus does acknowledge Snap’s user data (particularly its demos) are a bit sketchy, which is potentially quite problematic for a company that is solely ad revenue dependent. Accountability and measurement verification is only gonna grow in importance.
This might be a dumb question, what “intro to ____” course should I look into if I want to learn the basics of understanding trends like this. These charts still look like Chinese to me.
That can get weedy.What would help is the charts in one visual, which would allow you to compare the inflow of $ & the outflow. Then the lag correlation would really jump out.
Econometric Forecasting
Technical analysis. But, DON’T use it as a Bible for trading.
https://mobile.nytimes.com/…David Brooks has a much different view.
Those articles are hard to read – its a toxic mix of arrogance and ignorance.People like David Brooks, really smart but basically self absorbed – are how the current President got elected.The idea that he would now castigate the current President as an incompetent, while then spinning fairytales about doing better than the current administration ever could (as it enters its second month), is about all you need to know about how the USA got into this mess.Looking backward and mentally masturbating ideas about the future isn’t of any use. For all his many flaws, the current President does not seem to abide that type of dysfunction. As Winston Churchill used to sign his memos, ATD (Action This Day).Maybe that will prove to be a tonic.
Yep, how he dragged Trump into the article was nothing but baffling. That aside, the issues about entreneuship (decreasing according to him), increasing accord g to Bloomberg seems like an easy one one to settle
“there has been a decline in start-ups as a share of all business activity over the last generation,” he says.
7-10 yrs. Look out 2020 for exits. I think changing corporate tax structure will change internal hurdle rates and appetite for buying companies. I also think that the pace of individuals starting all companies is on a continual decline. By “all companies”, I mean cash flow businesses too. Kaufmann and other people that watch entrepreneurial activity say it’s down. A lot of that has to do with student debt. A lot of it has to do with the risk averseness of people.
what changing corporate tax structure?
The talk is they will go from 35% to 15% or 20% to become more competitive with the world market. (Economic efficiency would tell you it’s 0% since corporations don’t really pay taxes).
Continual decline since when (year)? And if due to student debt, is this decline only for the US? and the same question for risk averseness.
Been declining for years in the US
Per my eng. education, when I see a graph presented as image, with no scale, no underlying numbers, and no details regarding the methodology used to produce it, I ignore it.Show me the numbers, Lebowsky.
This is good to get a general understanding of trends, but hard to make sense beyond that without understanding the data behind it. For example, did a handful of companies contribute to 90 percent of the exit dollars, or was it less concentrated? How much was M&A vs. IPO, and how do the exit values correspond to the dollar raised? How do the inflows vary according to stage and sector?
Curious, how do these levels compare to say, 1996-2002?
Thanks for sharing.