
Measure Your Business with Data Analytics

[The following is an edited excerpt from David S Rose’s book The Startup Checklist: 25 Steps to a Scalable, High-Growth Business.]
When your startup is very small, it’s fairly easy to gauge its health. From your vantage point as the company’s leader—and perhaps its only employee—you can readily track the arrival and departure of customers, the growth or decline of revenues, and changes in profitability as costs rise or fall. But as your company grows and its complexity increases, measuring the success of the business becomes more difficult. It is important to develop a well-thought-out set of metrics, or measurement tools, and apply them consistently.
In Chapter 12 I discussed the basics of financial accounting, which provides one of the crucial sets of metrics that every business founder needs to understand. Now we’re going to extend our metrics tracking with some of the measurement tools and techniques that you will use in the second phase of your lean startup cycle: Measure. These are designed to provide simple methods to help you quickly and easily monitor the changing levels of success experienced by your startup as you build and iterate on your product.

Get the guidance you need when setting up your company for investment.
Use Your MVP to Establish Baseline Metrics and Begin Experimental Improvements
Creating a minimum viable product (MVP) is the best way to start testing the validity of your business plan with real-world customers. By offering the MVP to customers through sales and marketing channels like those you plan to use once your business is fully operational, you can quickly determine whether or not there is a real market for your product—and whether or not you need to retool your offering to make it serve a genuine customer need.
You can use your initial offering of the MVP to establish baseline metrics for your business. For example, suppose your product is a software-as-a-service that will be sold through online subscriptions. When you offer your MVP to an initial group of customer prospects, the results will include click-through rates for your advertising message, sign-up rates, trial membership rates, conversion rates, annual subscription rates, lifetime value rates for each customer, and the cost of sales and marketing activities per customer created. These baseline metrics will be a valuable starting point you can use to measure the success or failure of future modifications to your product offering and marketing strategy.
The baseline metrics generated by your first offering of the MVP will be worse than the financial projections you sketched in your initial business plan. It is discouraging—but it’s common even normal. Having established these a place to start, you can work to improve your growth model by developing alternative hypotheses that define changes with the potential to improve your results, then testing those hypotheses in sequence to see which ones to eliminate.
These alternative hypotheses may relate to improvements in the product itself. For example, through customer interviews, surveys, focus groups, or brainstorming among members of your business team, you might tentatively conclude that your product can be made more attractive by simplifying it. This idea can serve as a working hypothesis for you to test through an experiment with a new, more basic version of your MVP. If the metrics generated in this experiment are an improvement over the baseline metrics, you can conclude that the hypothesis is probably correct. You may want to create further hypotheses about possible improvements in the product for further experiments.
Over time, you can use a series of short, simple, rapidly iterated experiments to gradually refine your growth model until it is highly effective and powerful, producing metrics that match or exceed those sketched in your original business plan. Note that it’s important to test one and only one hypothesis in each experiment. If you conduct a market experiment that features both an improved product design and a redesigned website, it will be impossible to draw any clear conclusion about a cause-and-effect relationship from the results achieved, since you won’t be able to tell which change was responsible for the increased (or, for that matter, decreased) metrics.
Many startup founders find that split-test experiments (also known as A/B tests) provide some of the most useful insights into customer needs and preferences. In a split-test experiment you divide a prospective customer pool into two different, randomly selected groups. Then you offer different versions of the product to the two groups of customers at the same time, or, alternatively, offer the two groups the same product using differing marketing strategies or advertising messages. Different behaviors by the two groups of customers enable you to draw inferences about the attractiveness of the two product versions or marketing approaches.
Experimental product offerings can also be combined with survey and feedback tools to provide additional information about customer reactions to your MVP. For example, the Net Promoter Score® (NPS®) is a tool developed by Satmetrix that can be used to analyze customer concern about a particular problem and enthusiasm for a particular solution. In this system, customers are asked to respond to a single question—“How likely is it that you would recommend our company to a friend or colleague”—choosing their answers from a 0–10 scale, where 10 is “extremely likely” and 0 is “not at all likely.”
– Promoters (score 9–10) are loyal enthusiasts who will keep buying and refer others, fueling growth.
– Passives (score 7–8) are satisfied but unenthusiastic customers who are vulnerable to competitive offerings.
– Detractors (score 0–6) are unhappy customers who can damage your brand and impede growth through negative word-of-mouth.
Subtracting the percentage of detractors from the percentage of promoters yields the NPS®, which can range from a low of -100 (if every customer is a detractor) to a high of 100 (if every customer is a promoter). Many companies actually have negative NPS®, but the top growth brands with loyal customers, such as Amazon and Zappos, operate in the range of 50–80.
Your NPS is a metric that can be repeatedly tested through varying iterations of your product design, marketing strategy, and other changes to your business model. The more your metrics improve, the stronger your business model becomies.
How to Make Sure That the Metrics You Gather and Analyze Are Meaningful
The nature of your business will help you determine which metrics to use in analyzing the growth rate of your business. Among the most popular and important metrics that startup managers find valuable to track across all business categories are customer counts, number of repeat purchases, and sales revenues. But more granular data related to a particular business model may be equally important for your startup. For example, if you are building a business for which selling advertising will represent an important revenue source, then metrics related to the number of individuals who visit your website or download your media content—as well as their demographic characteristics—will be crucial, since advertisers will be interested in “buying the eyeballs” of large numbers of prospective customers with specific personal qualities (high incomes, for instance).
Intelligently designing the metrics and the reporting systems on which you’ll rely upon is important. As Eric Ries explains, all the metrics that you rely upon should be actionable, accessible, and auditable.1
– An actionable metric is one that demonstrates a clear cause-and-effect relationship. Your metrics are actionable when it is possible to separate out the impact of various factors on your startup’s rate of growth. By contrast, when the data you gather and analyze reflect the mingled effects of two or more factors—for example, changes in product design, marketing strategy, and communications message—it is all but impossible to determine which factor is chiefly responsible for a change in growth rate. This means that making smart decisions about future actions based on the data is practically hopeless.
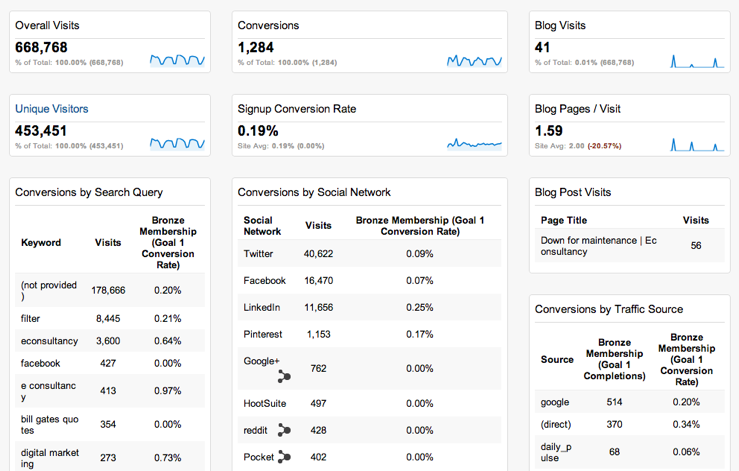
– An accessible metric is one that is clear, simple, people-based, and available to everyone in the organization. In many organizations, access to data is restricted to just a few top managers. By contrast, a well-run startup makes most or all data available to all employees, so that analysis, insight, and learning can occur throughout the company. The presentation of data is also important: You need to make sure that your metrics are presented in a written or visual form whose meaning can be grasped quickly and easily. One common approach to disseminating metrics is the use of “management dashboards.” These are usually special Web pages that are constantly refreshed with live data, providing an easy, one-glance overview of a company’s most important metrics.
This dashboard was generated by the software as a service platform Geckoboard.com, which can pull in information from many dozens of different sources and display them in an easily accessible manner.

– An auditable metric is one that is credible and susceptible to checking through customer interactions. Don’t rely on your programmers to develop metrics by themselves; instead, members of your product management, marketing, and service teams should help to shape the metrics and make sure they accurately reflect the information that really matters. You should also make a point of spot-checking the metrics that are reported to you through live interactions with customers. All too often, flaws in the design or reporting of metrics mean that the data presented to managers are inaccurate and therefore seriously misleading. Discovering and correcting such errors must happen as quickly as possible to avoid taking your company down the wrong path.
Cohort analysis is important technique to apply to the analysis of your company metrics in order to ensure that they are actionable, accessible, and auditable is cohort analysis. This refers to the practice of studying the behavior of separate groups of customers who come into contact with your product at various times rather than lumping all customers together into a cumulative set of statistics. Cohort analysis enables you to distinguish the impact of various changes in your business model on the results you achieve. It’s especially important during the startup phase, when you are likely to be conducting experiments with the goal of refining your business model to make it more responsive to customer needs and preferences.
The fundamental method of performing cohort analysis is by viewing all the customers who make contact with you during a particular time period—say, a certain month of the year—as a single pool. You would track all the relevant metrics for this pool of customers throughout their history with the company, from their initial contact (by clicking on your website URL, for example) through any purchasing activity and down to any additional interactions (such as repeat purchases). This history is often referred to as the customer life-cycle. The quantitative results drawn from the life-cycles of all the members of a particular cohort—for instance, the May 2016 cohort—can then be compared with the results for the preceding and following cohorts. Changes from one cohort to the next should reflect improvement—or deterioration—in one or more aspects of the business model.
The results yielded by cohort analysis are often likely to be more meaningful than those reflected in cumulative data, which lump together customers encountered under many widely differing circumstances. Cohort analysis can often enable you to pinpoint specific product, marketing, sales, and messaging strategies that have been especially effective—for example, a particular social media campaign, advertising blitz, public relations coup, or promotional offer that yielded much-greater-than-average results.
Following these principles when analyzing your company metrics will help you avoid the danger of relying on vanity metrics. These are numbers that give a rosy picture of company growth, even when the actual performance of the business is lagging.
Gross metrics—in which customer numbers, sales data, revenues, and other figures are simply accumulated month over month—are likely to fall into the “vanity” category. By their very nature, such cumulative data inevitably increase over time, often creating curves that produce an impressive image on a graph or table. Unfortunately, these escalating curves disguise the fact that successive groups of customers are not responding more favorably to your product or its marketing; in fact, the changes you are introducing to your business model may be having no effect or even a negative impact on customer response.
Cohort analysis can help you avoid the trap of believing the false image produced by vanity metrics by making it easy to see how customer response to your business model is evolving over time. By the way, don’t just gloss lightly over this warning. We entrepreneurs are an optimistic lot, and self-delusion is fundamental to our psychological makeup. We also don’t like to be disappointed, or to disappoint others. We therefore have an innate tendency to hold fast to good news under the theory of confirmation bias. Just as looking at yourself naked in the mirror is a better way to help you lose weight, so too is understanding the real metrics surrounding your customers’ behavior is a better way to the truth.
Finally, as you develop your metrics, make a habit of defining the growth milestones you hope to achieve and the metrics for achieving them in advance rather than after the fact. This practice will help ensure that the targets you reach are meaningful rather than “plucked from the air” to create an illusory feeling of success. Defining the metrics you hope to achieve before beginning a particular experiment will prevent “target slippage” and improve the rigor of your analysis.
Tools for Analytics
One positive aspects of the increasing move of startups into the online world is that everything can be tracked, measured, and recorded online…everything. If you wanted to do, you could record every single interaction of every single customer with your online product, including how long they stay on each page, what their click path is through your site, and even where on the screen their eyes are looking during their time on each page! But just because we can generate such data doesn’t mean that it would be particularly useful to us as a management tool.
Fortunately, a wide range of online tools have been developed to allow you to track, organize, and make sense of the most important things that are happening on your website. Here are some of the most useful that I’ve found:
Google Analytics is a free service for small businesses that has become the standard way of tracking website interactions with your users. By adding a few simple lines of code to each Web page, you can easily capture and report on customer acquisition, benchmarking, conversion, performance, cohort analyses, and much more.
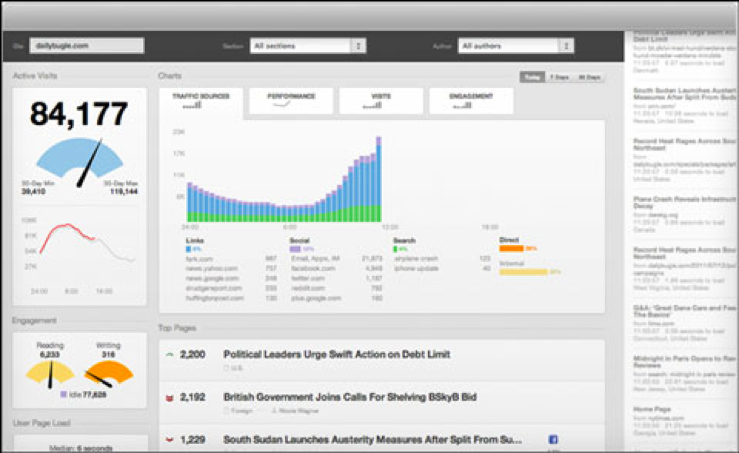
ChartBeat is a business dashboard that shows you a summary of success. You can track the concurrent visitor counts, compare Web traffic against Twitter chatter, analyze how people are finding your site—say, by searching Google or clicking a link on Facebook—and see history of Web traffic at a glance. To use ChartBeat, simply insert a small code snippet into the header and footer of each Web page.
KissMetrics is a comprehensive and easy-to-use analytics platform that is designed to help you optimize your marketing and conversion rates.
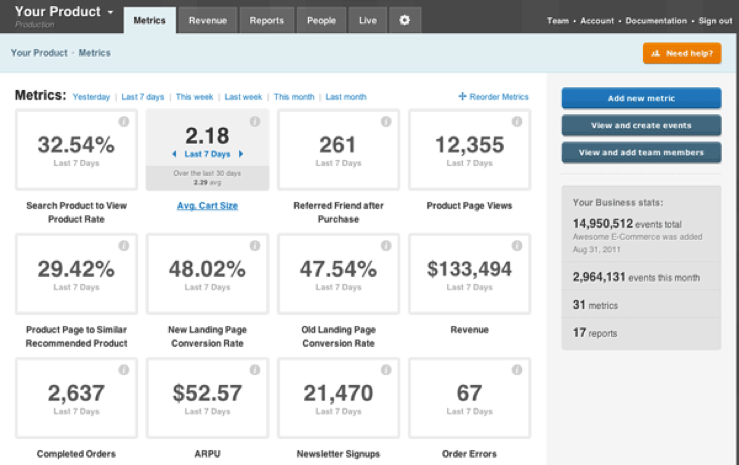
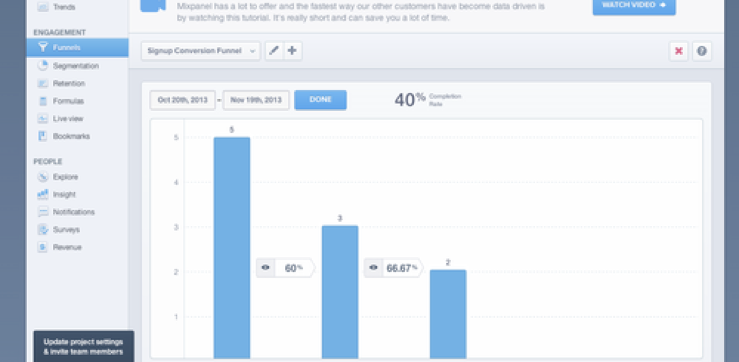
MixPanel gives you tools for both tracking user engagement across your product and following individual users and their specific actions, as well as doing detailed conversion analyses of your sales funnel.
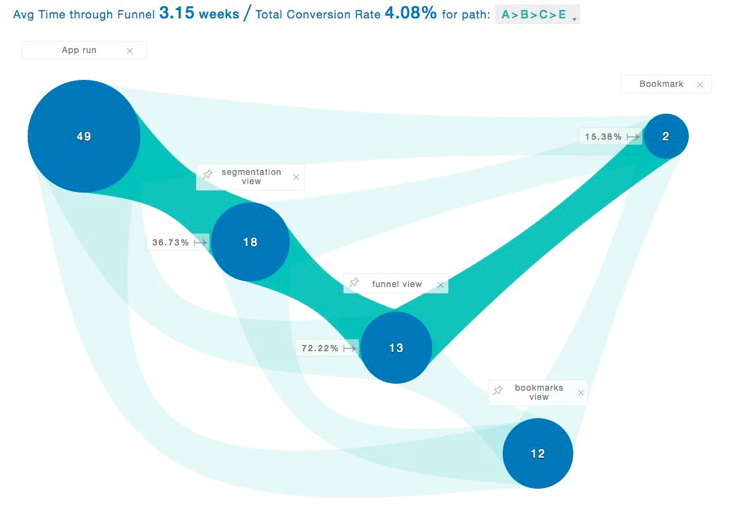
Indicative is a newer analytics platform specializing in the “customer journey.” For most businesses, the customer journey has become exponentially more complex, with many digital and physical touch points. In any engagement or conversion process, there are many paths to take and steps that may be skipped—and users may even backtrack and repeat steps. Accordingly, traditional analytics tools do not fully capture the complex nature of this interaction, while flowcharts of every interaction quickly become illegible. Indicative allows you to model complex, non-linear user flows, and drill into every step of the customer journey to identify issues and opportunities for improvement.
Key Growth Issues to Study with Lean Analytics
As you’ve seen, the main purpose of lean analytics for the startup business is to help you define the most effective strategies and tactics for achieving a high rate of growth in terms of customer numbers, sales revenues, and profitability. To do this you’ll probably want to conduct experiments to test the appeal of various product designs, marketing strategies, and sales approaches. In addition, you should consider conducting experiments on other factors that may affect your growth rate, including:
– Product pricing: The best way to test customer response to different pricing strategies is through actual marketplace experiments—especially through split-testing of alternative prices for the same product offering. You may be surprised by the responses you receive. It’s not unheard-of for a product to attract more customers when the price is higher, since a higher price is often associated with enhanced quality.
– Channel effectiveness: Depending on the nature of your product and the most likely customer base, varying channels for reaching customers are likely to produce widely differing sales results. For example, entrepreneurs Gabriel Weinberg and Justin Mares, in their great book Traction: A Startup Guide to Getting Customers, identify 19 different “traction channels” by which customers can be acquired2. You may be surprised to discover that a channel you considered irrelevant turns out to be your most powerful customer acquisition tool.
– The customer decision process: Every product is sold through a unique customer decision process, beginning with discovery of the product in a particular online or offline venue and involving a series of interactions that culminates in a decision to buy (or not to buy). One of the most important and useful pieces of marketplace knowledge you can develop is a detailed map of the customer decision process for your product, identifying such parameters as: How will most customers become aware of your product? What messaging factors will determine their initial degree of interest in the product? What questions will customers ask about the product? Whose opinions about the product will customers value? How will friends, family members, work colleagues, and others impact customer decisions about your product? How will customers test your product’s quality? What kinds of triggers in the product offering will lead to a purchase decision? You can—and should—develop hypotheses about each of these elements in the decision process, and test those hypotheses through experiments. The results will enable you to fine-tune your product offering and your marketing strategy to maximize their customer appeal.
Remember that it’s not enough to monitor the growth of your customer base and sales revenues over time. You also need to keep tabs on the amount of money you are spending to attract prospects and turn them into customers. This includes such expenses as the costs of designing and maintaining a website, the personnel costs for marketing and sales employees, costs for advertising and the purchasing of mailing lists, and so on. As part of your lean analytics process, you should track the total cost of acquiring a customer through the various marketing and sales channels you test. You’re likely to find that some channels are far more efficient and cost-effective than others.
You can combine this information with demographic data to determine the plausible scalability of your business. It’s great to identify a large population segment with characteristics that match those of the customers who are demonstrably attracted to your product. But your business will only be able to grow to scale rapidly and profitably if you can acquire large numbers of those potential customers through channels and marketing methods that are affordable.
Footnotes
1 Described in The Lean Startup, chapter 7.
2 Gabriel Weinberg and Justin Mares, Traction: A Startup Guide to Getting Customers (2014: S-curves Publishing)
This post is part of the “Grow” series of the Gust Founder Curriculum. Gust’s Founder Curriculum is a roadmap for founders navigating every stage of the founder journey. Check out our event series and follow along with expanded resources here.
Get the guidance you need when setting up your company for investment.
This article is intended for informational purposes only, and doesn't constitute tax, accounting, or legal advice. Everyone's situation is different! For advice in light of your unique circumstances, consult a tax advisor, accountant, or lawyer.