 I believe deeply in the value of making data accessible.
In service of that belief, there are few things that bring me as much joy as visualizing data (smart segmentation comes close). There is something magical about taking the tons and tons of complexity that lurks in our data, being able to find the core essence, and then illustrate that simply. The result then is both a mind and heart connection that drives action with a sense of urgency. #winning
While I am partial to the simplest of visualizations in a business data context, I love a simple Bar Chart just as much as a Chord or Fisher-Yates Shuffle. As we have all learned, tools matter a lot less than what we do with the tool. :)
In this post I want to inspire you to think differently. I’ve curated sixteen extremely diverse visualization examples to do that. By design none of them from the world of digital analytics, though I’ll stay connected to that world from a how could you use this idea perspective. My primary goal is to expand your horizon so that we can peek over and see new possibilities.
To spark your curiosity, the visuals I’ve worked hard to find for you cover the US debt, European politics, lynching and slavery, pandemics, movies, gun control, drugs and health, the Chinese economy, and where we spend our lives (definitely review this one!).
The sixteen examples neatly fall into nine strategies I hope you’ll cultivate in your analytics practice as you create data visualizations:
2: If Complex, Focus!
3: Venn Diagrams FTW!
4: Interactivity With Insightful End-Points
5: What-if Analysis Models
6: Turbocharging Data Visuals with Storytelling
7: The Magic of 2 x 2 Matrices
8: Close Contextual Clusters
9: Multi-dimensional Related Line Graphs
This post has quite a bit of depth, and loads for you to explore, reflect and internalize. It will take a few visits to absorb all the lessons. In as much, my recommendation is to read one section per day. Take time to really understand what’s going on, go to the site, play, look at the higher resolution versions (click on the images), make notes of what you’ll do for the first time or change about what you already do. Most importantly, practice taking action. Then, come back, read the next one and take action. I promise, the rewards will be rich.
Let’s go make you an even more effective influencer when it comes to data!
Strategy 1: The Simplicity Obsession
One of the reasons so many visuals are so very complex is that the Analyst/Creator is trying to demonstrate how clever they are. Sadly in the process of demonstrating aforementioned cleverness, the visuals ends up being incredibly complex crammed with every little bit of amazesomeness they are trying to demonstrate…

(Click on the above image for a higher resolution version)
There is absolutely no doubt in my mind that the Creator worked very hard, and, I sincerely mean this, they are very clever.
The problem is that the essence of what they want to communicate is probably only known to them, or to any person willing to take the time to first learn the job of the analyst, dig into the data themselves, create this picture and then understand what is being said.
It breaks my heart.
Go on. Scroll back up. See if you can understand what is being said.
In my humble opinion there is an additional subtle problem. The Creator was asked to plot the data, or perhaps share the insights, but it is unclear whose job it was to answer this simple question at the end: So What?
When you start with that as your destination, so what, as the creator of any visualization you are going to ask for a lot more context, you are going to make sure the visual is in service of the answer, you'll make sure your cleverness is focused on the outcome the data has to serve.
Please, please, please keep that in mind.
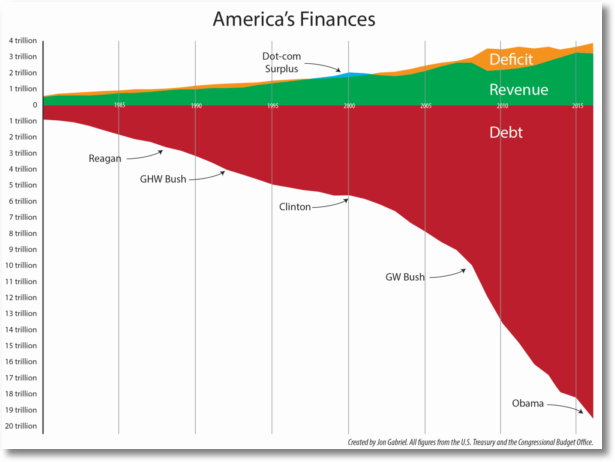
The complicated thing above is trying to highlight an important trend, is missing the context, and is simply not as dramatic as the reality of it actually is!
Here's a better visual showing the National Debt Burden, with four additional elements of context…
(Source)
Did you get what the point was in zero seconds?
Are you a whale-load more scared as you contemplate the red and the green?
Are you freaked out that if there is one thing both political parties in the US seem to be good at it is the red (!)?
That is what a good data visual does.
For the few of you that are a part of the team I lead, in addition to creating a visual for your analysis that is simple and effective, you know that my expectation is that you’ll come with recommendations on what to do.
To demonstrate that there are many paths to JesusKrishnaAllah… Here is another simple view of the debt, with a different x-axis, a stretched out y-axis, along with a different set of context…
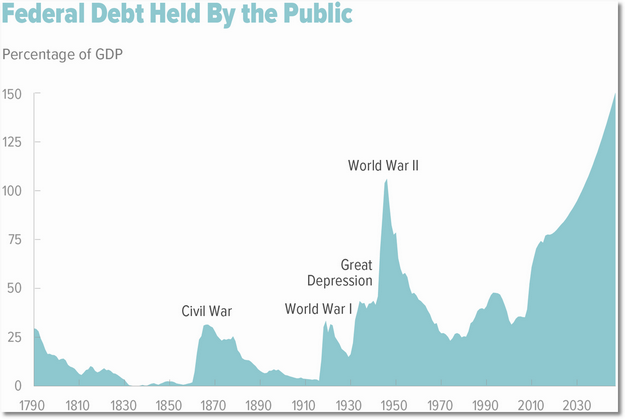
(Source: CBO)
Different questions, different arguments, different outcomes. But, you'll get to them much, much, much faster than the first visual.
I can’t stress this enough: Don't try to earn your performance review from the client/audience. Earn it from your boss. Tell your boss how hard you worked, show her how clever you are, earn her praise. Spare your client/audience – show them the simplest manifestation of your brilliant insight, with the NACR criteria applied.
(For more on using NACR to identify out-of-sights, see TMAI #66.)
Strategy 2: If Complex, Focus!
You are going to see my deep bias for simplicity for the rest of this post (or in the 745,540 words written on this blog thus far). I do not want to come across as a simplicity snob.
Deployed well, there are instances where I love complexity.
I thought this was exceptionally well done…

(Source: Michael Paukner | His Flickr collection)
(Click on the above image for a higher resolution version)
While it is a little difficult to follow all the arrows back to the original country, the shape of the graphic is an homage to the visual's topic. The background color could not have been more prefect. And, notice there is just the perfect amount of information about every tree.
There are other more subtle things to admire. I love, love, love that Michael put the US on the right. When we “trip up” our audiences like this, it gives them a pause and forces them to look at all the other information more carefully.
There is of course data itself that gives you many pauses. Notice the youngest tree in the graphic is older than Jesus Christ. Or, that we should all be so glad that the American West was settled last (by then we were more appreciative of nature as humans).
I am fine with complexity, if the essential makes it through. I am fine with complexity, if someone who’ll spend 1/100th of the time on the visual compared to you get’s it.
Strategy 3: Venn Diagrams FTW!
I love Venn diagrams. Ok, strictly speaking Euler. But, let's not get pedantic.
I've used them to simplify the presentation of complex topics. Ex: Six Visual Solutions To Complex Digital Marketing/Analytics Challenges
I am only slightly kidding but one of humanity’s most complex undertaking is to understand what the heck Europe is. One end's up ruing even asking, because you hear back EU, EEA, Euro Zone, Schengen, EFTA, and more.
I felt Bloomberg did a wonderful job with, what looks like an amoeba-inspired, Euler diagram…

(Click on the above image for a higher resolution version)
The color schemes are contrasted enough to allow you to follow along nicely.
The context from the sizes of the economy is a nice touch. (This is embarrassing but I was surprised how big Italy is, and how small Sweden is.)
The clusters of countries next to each other, for the sake of cleaner lines, all by itself has a built-in message. Cyprus and Ireland. UK, Romania, Bulgaria and Croatia. So on and so forth.
Overall, this is a topic that has been tackled numerous times, with painful to see results. Bloomberg managed to make it as simple as possible, with valuable built-in context.
Staying in the same geographic area, and my Euler-love, here's another fantastic visualization of often a very complicated answer: What is each political party in the UK promising?
I adore this as the answer…

(Source: Economist)
(Click on the above image for a higher resolution version)
Would you have believed that the totally out there UKIP would have something on common with Labour? Or that Labour is completely alone in the minimum wage issue?
The visual makes it easier to understand what we might be most interested in from the thousands of pages that form each party’s manifesto. You, the audience, is now empowered to agree more passionately with your party or feel the uncomfortable squirming that comes with realizing what your party is solving for. Both. Fantastic. Outcomes.
Clearly this is a political picture, and someone has to decide what to include and what to exclude because the parties promise the Earth, Moon and the Andromeda galaxy. But that is the life of an Analyst… They have to make tough choices.
Two hopes.
1. I hope every single news organization in every single country in the world will copy this visualization and create it for their main political parties. (Also see related NYT example on Guns below.)
2. What will you do with this? Can you pull out all the content types from your digital existence and create a visual like this one for which goal (overlapping goals) each type is solving for? How about displaying countries and products purchased? Oh, or your main traffic sources and the visitor acquisition metrics?
So much to do, so simply, and so little time!
Strategy 4: Interactivity With Insightful End-Points.
There is a common belief that your company’s decision makers would use data more if they could explore it – more efficiently, deeper, etc. This is almost never true, primarily due to the problem outlined in the orange and blue triangles that outline skill/competency and insights/action.
Hence, in a business context I rarely advocate for initiatives whose only purpose is to allow the broad collection of company employees to go on random fishing expeditions.
Exploratory environments can be useful, especially when they are 1. sharply focused 2. have an ability to eliminate dead end-points and 3. allow for smart elements like modeling. Let’s look at the first two below and the third one in the following example.
Here’s a valuable dataset from the Equal Justice Initiative on Lynchings in America.
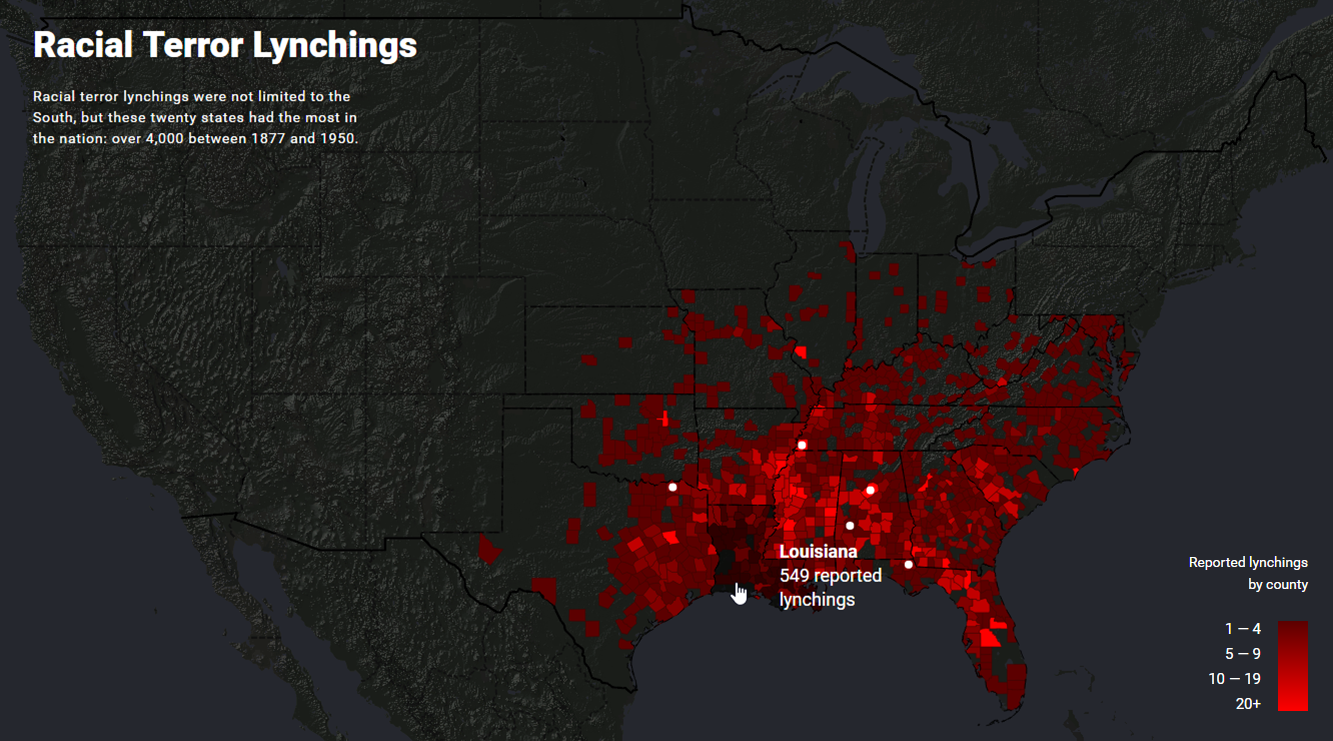
(Click on the above image for a higher resolution version)
Even at a glance the data is useful, along multiple dimensions.
In this case exploration of the data makes it even more valuable. You hover your mouse over your area of interest, and click…

You get your data drill-down, but what’s of most impactful is that you also get an end-point with a valuable insight providing meaning to the data.
In this case the number 29 for Jefferson County would be an insufficiently valuable end-point. The inclusion of Elizabeth Lawrence’s story on the other hand provides meaning. That is what gives the exploration a purposeful end-point.
You can now zoom out, move on to exploring other areas, continuing to get enriched value from the data.
In a business context when you are working with interactive data visualizations, ask this very valuable question: In a sea of data, whose job is it to include a logical end-point with an insight of value?
Surely, your terabytes of Google Analytics data dumped into a Tableau exploratory thingamagigy won’t magically throw them out there.
Surely, lay business decision makers, even senior ones, won’t have all the context they need to have to convert thingamagigy fishing expeditions, sorry, explorations, into the brilliance you feel the data contains.
Interactive visualization are great, only when packaged with insights for actions at logical end-points in exploration. Tweet that.
[SIDEBAR]
This is a difficult example to share because of the deeply emotional content it contains. But, those who do not learn from history are doomed to repeat it. Beyond the value of the lessons from the visualizations, I encourage you to explore rest of the EJI website. At the very minimum please consider spending five minutes listening to the story of John Hartfield told by Tarabu Kirkland, and six minutes on the story of Thomas Miles Sr told by Shirah Dedman. Thank you.
[/SIDEBAR]
Bonus: Another insightful visualization on this topic is at pudding.cool, The Shape of Slavery…

A bit more complex of a visualization, a function of the depth of data populated.
Follow the story of Louisiana as you reflect on the data.
Lots of data visualization, storytelling and life lessons in this data set as well.
Strategy 5: What-if Analysis Models.
Building on the thought above, if you create exploratory environments it can be exceedingly accretive to decision-making if we build in what-if type models. Rather than stopping at an end-point, provide an option of doing some type of sensitivity analysis with the goal of prodding the audience to take action.
For example… Let’s say they end up looking at Visitors, Conversion Rates, and Revenue. You can easily imagine how you want someone to explore that data by traffic sources or campaigns or geo or myriad valuable dimensions. You can create an environment where they press buttons to get that data.
Necessary, but not sufficient.
Why not build in a model where the decision maker can change Conversion Rates, to see the impact on Revenue? Move it from 1% to 1.5% to 8%. See what happens by traffic sources. Then, make a smarter decision.
Or, empower them to play with discounting strategies. What happens if they offer a 5%, 10% or 18% discount? Show impact on Revenue and Profit.
Even without bundling insights into your prepackaged environment, the what-if models allow your decision makers to play with scenarios, understand impact and make smarter decisions about what to do.
That’s the key. Don’t make visualizations with dead ends.
Here’s a great example of that from Mosaic. The visualization is about outpacing pandemics.
Quoting them: Vaccines are an essential weapon in fighting disease outbreaks. But how does the time taken to develop vaccines compare to the speed and frequency of outbreaks? And how can we do it better?
This is the simple view that greets you, outbreaks from 1890 to 2016 with vaccine development during that same time…

Each element is clickable.
As an illustration, the longest bar is Typhoid fever and the smallest, mercifully, is Measles. For each bar, click on Measles, you’ll see the first big outbreak (1917, 3,000 deaths) and the last (1989, 123 deaths). It is really easy to explore the data.
What I love is the sensitivity analysis.
Click on the yellow dot, and you’ll see that in action. First, you see what actually happened…

Simple exploration. Good reporting. Easy to understand.
The buttons with the number of weeks represent what I wanted to highlight here. Click on them, and it demonstrates what the outcome would have been if action was taken earlier.
I choose 22 weeks…

Even if the vaccine had been introduced after 22 weeks, a long time, we could have saved 1,628 lives!
The team also built in some hypothetical scenarios to help inform decision-making.
You can play with the implications of a fast-moving flu-like pandemic. It would have grievous overall impact, 30 mil deaths in 12 months.
But, what if we restrict 50% of the travel since we don’t have a vaccine yet. That would have an impact…

Not quite as material as one might imagine, but it slows things down.
What if a vaccine was introduced 22 weeks in?

Insanely helpful. 17 mil lives saved.
This type of modeling is rarer than seeing a rhino in the Ngorongoro crater. (We were there last week, you should go, it is pretty awesome.)
As an analyst, as a Big Data person, as a Data Scientist, pouring the right data on humanity is only marginally effective. In this example, in others above, I hope you’ll see the type of additional creativity we can bring to our work to power smarter decision-making. Starting with no dead end-points.
Strategy 6: Turbocharging Data Visuals with Storytelling.
You know this. Even if data is shared in a simple environment, most people are unable to internalize it. As has been hinted in most examples today, the problem is that the Analyst’s brain has not been packaged with the data.
The Global Gender Gap Report is a fabulous example how to solve this problem. The team nor only shares in a simple and beautiful environment, they also include the story they want to tell in that same environment. The output is not the reporting, the output are the conclusions from the Analyst’s brain.
It is very difficult for me to show the beauty of what they have done in static screenshots. You just have to go there and scroll.
Explore how the initial trend in the gender gap morphs into multiple visualizations, note the subtle but important emphasis on trends, and, most importantly, feel joy from how the story is presented with the data (text on the right).
The website and visualization will work on your mobile device (yea!), but it is best admired on the largest screen you can find.
To tempt you, let me just contrast the gender gap performance of the United States (precipitous decline in the last two years!) with… with… inspired by FLOTUS, the 10 year performance of Slovenia…

Play with the histogram and scatterplot options.
Go back and forth a few times (yes, gender parity is an issue I care deeply about), make sure you absorb the many nuances both in the story (why the above stinky performance by the US?) and the way the text (story) and the visualization (data) play together.
When you send data out, is it bundled with a piece of your brain?
Remember, you’ll be the last person with the intelligence and skills to understand the deep layers and nuances in what the data is actually saying (assuming you are an Analysis Ninja!). It is imperative that your brain go with the data.
Bonus 1: Another fantastic example of this type of sequential storytelling is Film Money….
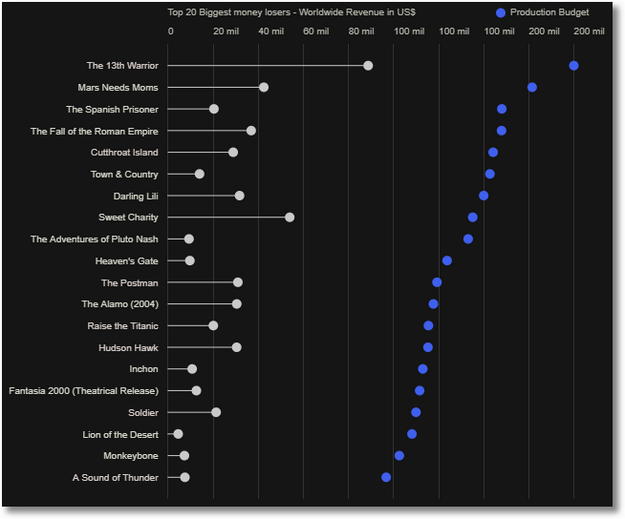
Lars Verspohl takes you along on a wonderful journey through cost and profit structures of movies. Like me, you’ll love the simple and delightful visualizations, how gracefully flow it all flows, and that all the charts and data are primarily there to support the story that emerges from his analysis.
Please also note the thought put into the order in which the story is told, if and when the visualizations switch (from the one above) and the techniques deployed to keep you interested. All excellent, loads to learn.
Bonus 2: This is one subject, storytelling, that I just love, love, love. Indulge me as I pile on and share one more, dramatically different, example of storytelling where data and text go hand in hand.
The team at Reuters Graphics does a fab job of explaining China’s debt problem.

Almost all the visuals are extremely simple. As you scroll through, observe though how they peel back layers of the onion one by one, segment the data, and zero in on the core point they want to make.
Really lovely. Worth emulating.
Strategy 7: The Magic of 2 x 2 Matrices
If you’ve read anything on this blog, you’ve read the importance of seeking why answers to provide critical context to the what answers that you get out of Adobe or Google Analytics. Hence, the amazing value of Surveys, Usability Studies (on or offline), Heuristic Evaluations, shadowing Customer Service calls, and more.
Customers are an amazing source of problems they are having, sometimes they are also a good source of ideas. The challenge is that if you ask people for their opinions you get tons of ideas.
How do you value them? How do you present them? How fast can you get from data to action?
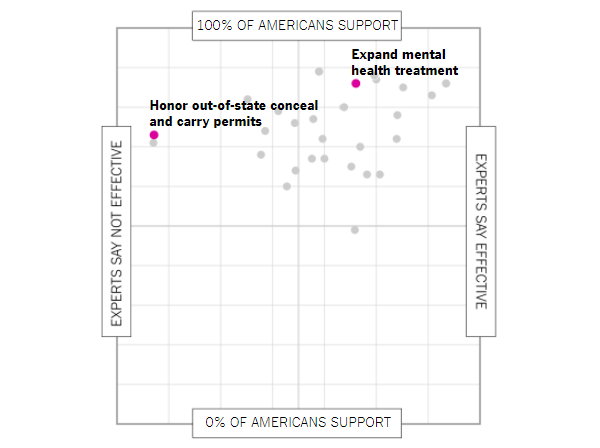
One solution I love is a visualization strategy used by the team at the New York Times. The example illustrates, simply, the ideas related to an emotionally charged topic: Gun Control.
Everyone knows this is a polarizing topic. Friend against friend. Blue vs. Red. Police and minorities and every other combination thrown in. It is a mess.
But. Is it really as fraught with angst as we believe?
No. It turns out if you ask Americans about individual ideas that will reduce gun deaths… A vast majority of us agree!!

The lowest supported idea is “Demonstrate need for a gun.” Support for it is just shy of 50%. A number that simply sounds unbelievable.
Did you think vast majorities in our countries agree with these common-sense ideas? I have to admit I did not. It is hopeful data.
But, this is not the reason for the inclusion of this visual on our list.
Rather than just share the ideas, the NYT team added incremental value (remember packing the Analyst’s brain?) by asking Experts to opine on the effectiveness of each idea. That’s what you are seeing in the distribution above.
From the 2×2 matrix, here is the slice of ideas American’s support and the ones Experts say are effective…

There are only two ideas rated as ineffective by Expert, but are supported by over 70% of the Americans (national stand your ground law and honor out-of-state conceal and carry permits).
We all basically agree on ideas, and a lot of them will have an impact.
I love the presentation of the ideas and the fact that Experts were brought in to give valuable context. This is what I meant in my above example by not simply taking all the customer ideas and running with them. A wonderful way for you to visualize multiple ideas, and you can combine it with an Expert dimension or a Customer Satisfaction dimension or even a Revenue dimension to give context to the ideas.
One last element of value from NYT.
I’ve said that all data in aggregate is crap. I’m so happy that the NYT team also segmented the data.
What does Mr. Trump support…
What do American law enforcement support…

And, lots more slices that make the data even more meaningful.
Segment. Always, always, always segment!
It is beyond the scope of this humble analytics blog to explore why in the face of such unanimity that nothing actually happens when it comes to reducing gun violence in the US. But, for lovers of data, for believers in the power of data to drive smart decision-making, this is one more reminder on the limitation of data if you can’t tell the story properly.
Strategy 8: Close Contextual Clusters.
Let’s close with examples of work that you’ll normally include in your enterprise analytics efforts.
Usually data we have is lonely. Just the Visits or Assisted Conversions or Order Size. Without other contextual elements, it turns out this data is less useful.
Consider this, conversion rate could go up by a statistically significant percentage… While revenue actually goes down. Or, the overall Visits to the site stay steady… But drop dramatically from your usually second highest source.
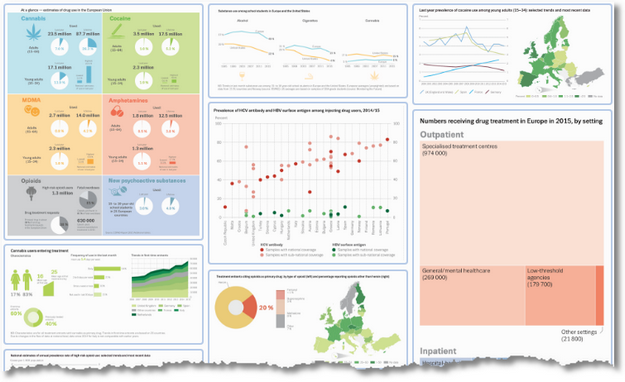
The European Monitoring Center for Drugs and Drug Addiction, also known by the gorgeous acronym EMCDDA (!), publishes a ton of data. Their Statistical Bulletin 2017 has a lovely collection of graphs and charts that we all use in some shape or form. The only difference is that we rarely report on Heroin Price and Purity. :)

Along with the use of (mostly) simple visuals to illustrate the data, I appreciated the context that they provide. Sometimes using the time dimensions, sometimes using geographic breakdowns, sometimes using two likely interplaying elements (like above), so on and so forth.
This simple strategy is quite effective at delivering insights – or at least causing the audience to ask relevant interesting questions.
I encourage you to take some time and explore the numerous examples on the site…
I’m confident the visualization strategies will spark upgrades to the work you are doing at your company to communicate data more effectively.
Our friends at the EMCDDA mostly avoid two things that I find as poor practices in data visualization. They triggered this in my mind, let me take the opportunity of sharing them with you.
1. Never ever, never, never, never create the loooooooooonnnnnnnggggggg infographics that seem to be in vogue these days. Essentially they are taking 69 “slides”/graphs/tables and shoving them into a 9-meter-long thing that no browser can render decently. By the time you absorb the third screen full of stuff in tiny font/image, you’ve already forgotten what’s on the second. You have many examples in this post as to how you can avoid making yourself look like sub-optimal Reporting Squirrel.
2. Pie-charts are a very poor data visualization choice. Humans find comparison by angles significantly harder than, for example, by length. I explain this a lot more in the May 14th edition of my newsletter The Marketing Analytics Intersect: Eat pies, don’t share them.
[You should subscriber to TMAI for a weekly dose of intelligence that’ll keep you at the bleeding edge of our industry.]
Bonus: In the spirit of government data, I’ll be remiss if I did not share with you three examples of interactive scatter plots from Our World in Data (produced by the University of Oxford).
The second one is timely, it shows how when we look at health spending and life expectancy the United States is a massive outlier (and not the good kind)…

I love fusion charts, the first one on the site, Child Mortality vs. Mean Years of Schooling, is a good example of that as well. And, it shows great news.
Please review all three. Then, consider plotting one for your digital data. Conversion Rates by Discounts for Top Ten Traffic Sources. Time on Site by Visits to site for Content Types. And, more.
Strategy 9: Multi-dimensional Related Line Graphs.
One final example, to cause introspection about the final years of your life.
Wait. Things really got serious.
They did. But, I really do want you to lean into this one.
A small reason is that you are likely creating graphs like these every single day for your dashboards. I hope you’ll find lessons in how to make yours simpler. Notice the use of fonts and colors. Notice the labeling, or not, of the axis. And other little things.
A big reason is that I care for you deeply and I want this data to be a cautionary signal to all of us to possibly start making new choices.
The plots are from the American Time Use Survey, a multi-year study from 2003 to 2015 conducted by the US Bureau of Labor Statistics.
Age on the x-axis and hours we spend per day with on the y-axis…

(Source: halhen on Reddit | Github)
In our 20s we’ll spend most time with our friends and our parents. Our partner and co-workers will take over our lives from then on through our 50s.
I’ll let you internalize the rest, and please share via comments what you see as the lessons in this data.
Three things stood out for me, as I consider the larger latter chunk of life. 1. We might be giving an extraordinary amount of importance to our co-workers, perhaps worth a rethink. 2. I love my spouse, regardless of who goes first, I felt very sad after staring at the Partner and Alone graphs. 3. The data demonstrated the value of loving oneself – of being proud of who you are, of being comfortable in one’s own skin. After all each individual will spend huge chunks of a decade plus… alone. You have from now until you are 50 or so to get there. Hurry!
: )
The power of great data visualized simply.
Closing Thoughts.
The sixteen diverse sources and visualization strategies help you think differently about how you are bridging the critical last-mile when it comes to impact from data – from you to the person who’ll take and action of business value. We don’t give enough time and attention to this last-mile.
While some of these clearly take special skills (especially the ones that tell integrated stories), I hope you’ll note that most of them are simple and ones that you can create with just a little more effort.
What’s most important today is that I’ve sparked your commitment to upgrading your personal data visualization skills.
Good luck!
As always, it is your turn now.
Which one or two examples did you like the most? Why? Is there a visualization technique you deploy in your analytics practice that’s not covered in this post? What barriers prevent you from improving your data viz skills? What are your pet peeves when it comes to data visualizations? Do you have go-to sources when it comes to inspiring you?
Please share your tips, best practices, critique, and praise for the people who created the above examples, via comments.
Thank you.
PS: I was not kidding in the opening of this post… I've written a lot about data visualization and shared guidance for this type of storytelling in numerous different contexts. To continue your immersion, here's another collection of knowledge…
~ It's Not The Ink, It's The Think: 6 Effective Data Visualization Strategies
~ Great Storytelling With Data: Visualize Simply And Focus Obsessively
~ Data Visualization Inspiration: Analysis To Insights To Action, Faster!
~ 7 Data Presentation Tips: Think, Focus, Simplify, Calibrate, Visualize++
~ Excellent Analytics Tip #21: Convert Complex Data Into Simple Logical Stories
I hope you love it, and paint more beautiful pictures with your data.


 Via
Via 


You've compiled a good list of data visualization story-telling techniques but you haven't mentioned the technologies that power these visualizations.
d3.js powers some of these visualizations but I'm sure there are lots of techniques. A second post about the methods to create these visualizations would be interesting. It doesn't need to be a step-by-step but it would be nice to have a direction for learning more about creating each visualization.
Zach: Sadly I have kept coding off the scope of the blog, not because it is not important but more because it is not hard to find coders who can do it. I do appreciate the feedback, and I'll consider it for a future post.
Meanwhile if you know of someone with decent javascript skills, they should be able to do so many of these (if not all). An additional resource might be a graphics designer – for some extra front end love. :)
Avinash.
Methods to create visualizations is always good content to generate. D3 'how to' is a bit complex considering the content on the blog! D3 is very advanced to throw in a blog when describing effective data visualizations and the impact they create.
My friend just told me about your website Avinash, will be back to read more soon. Thanks for insights. I've been working in business intelligence for nearly a decade.
Good stuff :)
Take care.
An amazing post avinash with such a great collection of inspiring visualizations.
I also want to underline that what's more valuable for me is reading your dissection of each visual. In more than one case I discovered things that I would not necessarily have caught.
One request. Is there any way to get TMAI 66? I am a recent subscriber and am not sure how to find it. Thank you.
Emma: So glad the post was helpful.
Sadly there is no accessible archive of TMAI (by design), but you can access TMAI #66 here: Say no to Insights, yes to Out-of-Sights!
-Avinash.
This is one of the best piece yet, Avinash. In the Venn diagrams section, I thought the Bloomberg one was sort of difficult to read, but granted it is such a difficult thing to visualize. The Economist Venn diagram was great, though!
The final graph on "the people who keep us company" was really well constructed, with the big "alone" graph shooting out of the bounds of its y-axis.
In the field of web analytics an emphasis on visualization is sorely lacking. We do put some basic charts into our dashboards. Primarily though we share tables stuffed with metrics which are quite difficult to understand.
Happy to see that you are consistently beating the drum for this skillset. Really great post.
I love your point about not trying to "earn job review from the audience." I had not heard the problem quite framed in this insightful manner.
The examples from the EJI and Pudding were deeply moving. Truly data presented in a way that educates and makes you care deeply about a topic. My favourite recommendation was the strategy to create sensitive analysis to allow our bosses to make smarter decisions.
Tom.
Great blog! As always. Ill study it in detail and take action when I have some time for sure! You already made me into a 'eat my pies only' sort of guy so I can't wait to see what's in their for me to learn. I commented actually to give some pointers to Zach for resources.
@Zach: free JS lib with complete core http://www.chartjs.org/samples/latest/ of when you have some deeper pockets you can get some design out of the box also with https://www.highcharts.com/demo/area-inverted but their many many many more and in even more languages. Take you pick? But if you need to ask then you probally don't know what to do with these? Take a look at something like super metrics add-on for G Sheets?
But there is no substitute for thinking what to plot so you are own your own there. Everybody can buy a brick but only few can make a nice looking structure let alone a real head turner. It's the same everywhere I guess: it's hard work to be great like Avinash for instance. All the more respect I say.
Thank you for your posts, Avinash. They are always so helpful! (Nice job finding a way to reference politics without making anyone angry… hard to do these days.)
My favorite chart was from the Film Money project. Most of my clients are already pretty comfortable with scatter plots and error bars discussed in context of data-driven decision making. It makes me happy to be able to provide a visual illustration of -what we're doing and why- that really makes stakeholders feel like they understand what's going on. The Film Money chart is such a simple, clean way to visually contrast expense and revenue (and all kinds of other things!) I love it!
Great post.
I would love to hear/see a sort of a step-by-step process (funny flow chart?) for how to highlight the data you want in a graphic. When to use the line chart vs. bar chart vs. scatter plot vs. Venn diagram, kind of thing.
I am sure it's been written about before, by you or someone else, and I am just not aware. But then beyond this most basic choice, how to include a more complete picture of the data.
If not a funny flow chart, than a more dry checklist. This is for the more formal presentation of prepared info-graphics, which I am all for. But the principles you subscribe are useful even for those more every-day, on-the-fly, and for-the-boss-who-is-waiting-for-it-now kind of charts.
On a more personal note, since I always take a step back and look at the context and who is the author/presenter/messenger, I like all the subjects you covered here. I learned something about the trees in Utah and elsewhere, I confirmed some suspicions I have about incarceration vs. slavery, and I sent the slavery graphic, the US Debt graphic, and the UK political party graphic to my 18 y.o. (YIKES! HE's GROWING UP!) who has a real interest in these subjects, as well, and who could benefit from a little organized information. (Info he didn't already organize for himself.)
Christian: For the first part, our good friends at Juice have already created an excellent resource that I can't recommend enough:
~ Chart Chooser for Excel and Powerpoint Charts
You can also download sample files pre-configured.
For me personally, if I have five hours to create a chart for purpose x… I'll spend 1.5 hours with the team I'm working with on a white board in discussion, critique, purpose definition, brainstorming segmentation, sketching some design ideas etc. Spend 2 hours analyzing the data and truly looking it from different angles. 30 mins creating the chart we first thought would work. Then, realize what's missing from the picture or why the picture does not look good and spend the last 30 mins redoing it in a couple different ways. :)
Some of this of course does not apply to some of the pictures you see in this post, they'll have a lot more time spent on the visuals. But hopefully gives you a sense.
Avinash.
Thanks Mr. Kaushik for always keeping us updated. Your tutorials are always full of insights and details.
I have been an avid reader and I have learned a lot from your write-ups.
Thank you for sharing my future visualization go-to sources, Avinash! :) I really liked Euler diagram from the Economist. It has a simple design and easy to interpret message; coupling this with the extensive text analysis based on a number of different sources, makes this example stand out. In addition, it lends itself nicely to a Web Analytics arena: one could possibly visualize product categories purchased through different marketing channels to not only see the overlaps, but also to come up with better promotional initiatives. After all, creating an index of products and channels could yield higher ROI results.
Your infographic comment is spot-on: some analysts are more interested in creating an aesthetic visual that provides no value, than creating a data visualization that actually tells a story, albeit not being as artistic.
I find the work of the following dataviz gurus most inspiring: Edward Tufte, Stephen Few, Nathan Yau, and Cole Nussbaumer Knaflic.
An amazing post-Avinash with such a good assortment of exalting visualizations.
I conjointly need to underline that what is additional valuable on behalf of me is reading your dissection of every visual. in additional than one case I discovered things that i'd not essentially have caught.
Thanks for sharing
To answer your question my favourite is #5. I'd not realized how a simple strategy can be so effective in driving our decision makers to play with the data.
I did a small experiment in our company with this. An additional learning was that the decision makers felt they had more skin in the game as they had to lean in a bit more to do the modeling.
Great advice Avinash.
Great Blog. Very well explained about creating High-Impact Data Visualization.
In addition, it adds itself nicely to a Web Analytics arena: one could probably visualize product categories purchased through different marketing channels to not only see the overlaps, but also to come up with exceptional advertising vision.
After all, creating a list of products and channels could produce huge Return on Investment and all the graphs are really well designed.
Thank you so much for writing 9 Effective Strategies about Data Visualizations.
I have learned a lot.
Great post avinash.
I was surprised that you did not use an infographic from Information is Beautiful http://www.informationisbeautiful.net in your examples of great visualizations.
I use their website as a reference and find it to be quite inspiring. Would love to hear your perspective.
Andrea: Like you, I am a fan of David McCandless and the work that his team does.
My professional focus is a bit different, I obsess about the visualizations we can create and use day in and day out in service of analytics in a company. I find that single-purpose custom visualizations are less directly useful (even as they can inspire us).
Avinash.
Over the last month I've found myself returning a couple of times each week to try and truly get everything that you've shared in this post Avinash. I keep discovering layers as I dig into the examples.
The overall lesson for me is to strive for simplicity and to not assume that people who are receiving the data will know what to do with it. This seems to be a consistent thread, solved with multiple creative approaches.
Thanks for this deep post.
Awesome post thank you for sharing this big collection of new ideas with us.
The two examples of "packaging our brains with the data" resonated deeply with me. They were such simple ideas. To test them I experimented with an updated version of our corporate dashboard by adding what if modeling. The reaction from our VPs was massively positive. I have been invited to present it to the CEO and to train other departments to use a similar approach.
Now I just have eight more ideas from your post left to try Avinash!
This post was an eyeopening experience. Each of the nine stories has ideas that expose a completely new lesson or a new dimension to solving an interesting challenge.
Multi-dimensional related line graphs is directly applicable as something that can be actioned pretty quickly. The value of adding stories to the data is the one that will take a little more time but is going to have the biggest impact in our work. We've always struggled to figure out how to add meaning to data – what you call story – as we are only expected to data suppliers.
Great effort here Avinash. Gracias.
Hi Avinash,
Thank you for this great article!
A bit overwhelmed with all the valuable information you were able to pack into this article, but certainly highly relevant knowledge.
I preferred strategy 8, and that's because I find storytelling so important.
Thanks again Avinash!
Great Blog Post!!
I liked #3 very much. Simple and effective way to present data.
Totally agree Avinash.
Data visualizations for reports is probably one of the last steps in communicating the metrics to the stakeholders.
And to do it in the most effective way is key in helping business in taking strategic data driven decisions.
– AT.
Very interesting and informative blog I am much more knowledgeable that I was yesterday.
BTW thanks for the recommendation on the podcasts on lynching as a person of colour from the Caribbean it was extremely hard to listen to those stories, wow (heavy sigh).
Hi Avinash!
Amazing article as always!
Very thorough and interesting.
Have a great weekend!:)
I work in a role where most incentives drive towards complexity. Provide more data to the company with more visuals. To do so faster.
Occam's Razor provides a consistent reminder to reorient myself and to keep solving for simplicity.
It was amazing to see examples of innovative visualizations that each in their own way simplified the story they were trying to share. Block Parties by the Economist was an highlight for me. Two by Two matrices is an idea that we can implement in my work almost immediately.
Thank you Avinash.
I have got so many new ideas from this awesome article and your images are great.
So glad i found your blog after doing some searches on google.
Many Thanks.
Much obliged to you for sharing my future perception go-to sources, Avinash! :) I extremely loved Euler outline from the Economist. It has a straightforward outline and simple to translate message; coupling this with the broad content investigation in light of various distinctive sources, influences this case to emerge. What's more, it loans itself pleasantly to a Web Analytics field: one could picture item classifications bought through various advertising channels to see the covers, as well as to concoct better limited time activities. All things considered, making a record of items and channels could yield higher ROI comes about.
Your infographic remark is right on target: a few investigators are more keen on making a tasteful visual that gives no esteem, than making an information perception that really recounts a story, though not being as masterful.
I discover crafted by the accompanying dataviz masters most motivating: Edward Tufte, Stephen Few, Nathan Yau, and Cole Nussbaumer Knaflic.