11/28/2023
Spotlight
Report: The State of New York Tech
In 2023, venture fundraising in New York City area startups returned to 2020 levels. There was a continued shift in focus to early-stage investing amid sectoral changes, with challenges remaining for growth-stage fundraising.

New York has more Fortune 500 companies than anywhere else, is the second largest technology talent hub in the United States, behind only the Bay Area, and is home to 3 million immigrants, with first or second generation migrants comprising nearly 50% of the workforce (studies indicate that immigrants contribute disproportionately to innovation with ~45% of Fortune 500 companies founded by 1st or 2nd degree immigrants). There are over 25,000 tech-enabled startups and 300+ venture capital firms based in NYC. It is a thriving, dynamic ecosystem.
Since Lightspeed opened their NYC office earlier this year, we’ve made 7 investments in local startups and over 50 since 2004 representing $1 billion+ in total investment. Year-to-date we’ve announced our investments in: Wiz, Joopier, Beehiiv, Patronus AI, Summer, and Keychain. We’re excited to continue to invest and support local founders.
Venture capital-backed companies, representing over 40% of public U.S. companies founded since 1979, are a fundamental bedrock of innovation.
Nearly a year ago I exchanged London, one great global city, for another, New York and I’ve since picked up a few localisms. Firstly, the habit of “bopping around” from place to place. No other phrase quite summarizes New York’s energy and vibrancy. Secondly, embracing ‘fall’ for all the spirit and tradition it encapsulates beyond the autumn leaves. Localisms aside, I’m constantly inspired by the great people I meet in New York and am genuinely excited for the future of tech in this great city. Since moving to New York full-time at the end of 2022, more than a dozen friends, founders and operators in my network have relocated to the city from across North America and the pond in Europe.
Although the statistics on relocation are based on anecdotal evidence, they offer encouraging signs of the underlying positive momentum underpinning the tech scene. This “State of New York Tech” report for 2023 delves into the state of venture capital.
Executive Summary / 2023 Highlights:
- Return to 2020 levels: Overall, 2023 saw a continued decline in venture fundraising in New York, mirroring the broader landscape and returning to 2020 levels from a deal count and total capital invested perspective. New York startups raised a total of $10.7B across 812 deals¹.
- Challenges for late stage investing continues: the pace of late-stage (Series B through to Series F) retrenched more than early-stage fundraising (Seed and Series A), with the median round sizes for growth-stage companies down more substantially. There has in other words been an increased focus on early-stage investing, with the reality of the public and private valuation reset.
- Sector shifts: Across the top 20 verticals, deal count declined on average (45%). Fundraising within AI and ML deployment startups was most resilient, declining only (23%), whilst Fintech, Crypto and Real Estate Tech declined more than (50%). Conversely, fundraising deal count grew by more than 10% across Construction Tech, Advanced Manufacturing and AudioTech.
- New York’s share of US fundraising continues to rise, passing 15% market share for the first time on a deal count basis. On a volume basis New York’s share declined to 11.8% from 12.7% in 2022.
- Sector Concentration: New York’s growing share of Fintech fundraising grew to 24% as % of total US fundraising in 2023, from <20% in 2017. Other sector strengths include eCommerce, Mobile, Real Estate Tech and AdTech. Within AI and ML deployment, New York represented 14% of total deal count, slightly up on 2022.
- There are now over 146 unicorns in New York, two more than when compared to 2022.
- Fewer Startup Job Postings: Net new tech jobs in 2023 are forecast to decline (30% YoY).
Number of Investments
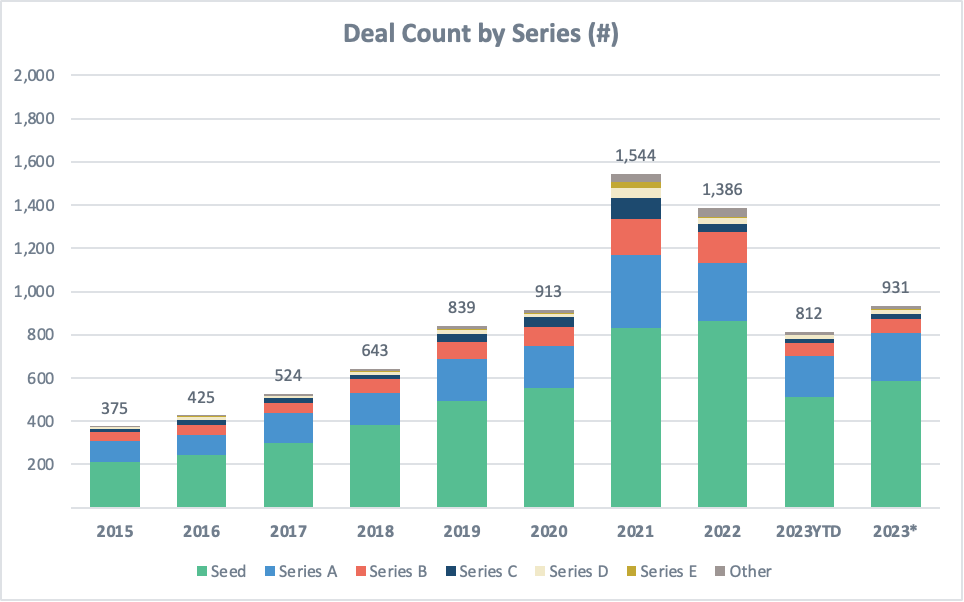
In aggregate, the number of deals in New York-headquartered startups fell (33%) in 2023¹. It was the slowest year for activity since 2021. This is roughly in-line with the broader US environment which is down (34%) year-over-year (YoY).
Seed and Series A stages were the most resilient, reducing (32%) and (18%) YoY respectively. In comparison, Series B fell (54%) and Series C (38%)¹.
There were 511 and 192 Seed and Series A investments year-to-date (YTD). In comparison, 57 Series B, 21 Series C and 31 Series D+ investments YTD.
There were fewer instances of lead investors taking board seats. In other words, there were more follow-on investments and series extensions than before.
Total Capital Invested
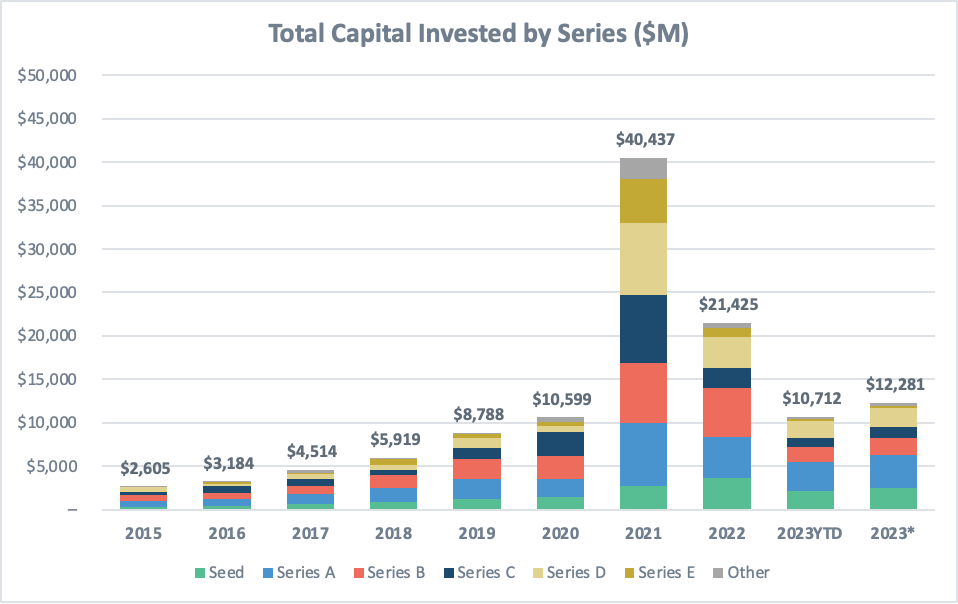
Total capital invested was down (43%) on an annualized basis, from $21.4B in 2022 to $10.7B 2023-YTD ($12.3B when annualized)¹.
The precipitous decline in total capital invested (43%) vs. aggregate number of deals (33%, per above), is indicative of the valuation decline for new financing rounds in aggregate.
Seed and Series A stages reduced the least year-on-year, down (32%) and (20%) respectively. In comparison, Series B fell (65%) and Series C (47%)¹.
Number of Unicorns
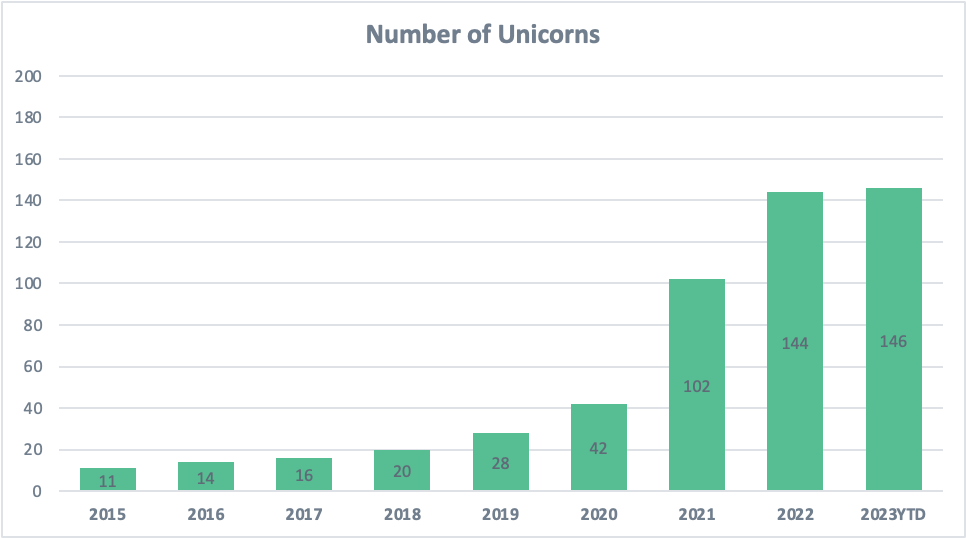
The number of unicorns (valued at >$1B), whilst an arbitrary measure, is one indicator for the health and dynamism of the tech sector. Whilst fewer private companies are going public and staying private for longer, many unicorns eventually go public (it’s estimated that around 25–30% of unicorns eventually pursue an IPO vs. 20–25% acquired and <2% failure rate).
New York is now home to 146 unicorns, up from 144 in 2022. With that said, we should caveat that there were few announced down-rounds and the statistic may not be representative of the updated internal fair value ascribed to equity awards.
There were 8 new unicorns in 2023 (2 net new unicorns when adjusting for exits) including:
- RunwayML, a creative suite applying generative AI tools on video and image editing;
- CoreWeave, a cloud infrastructure platform providing computing resources for blockchain;
- Headway, a consumer healthcare provider that matches people seeking therapy with insured mental health care providers;
- LIQUiDITY, a financial asset management firm, that specializes in providing non-dilutive, and unsecured capital;
- Kindbody, holistic health and fertility services;
- Prove, an identity-verification software;
- Capital Rx, an enterprise pharmacy platform;
- Avenue One, a property technology platform and marketplace for residential homes.
With respect to New York being the center of gravity for European and Israeli startups expanding to the United States, there are now:
- 407 UK-headquartered startups with offices in the city;
- 146 French;
- 94 German;
- 70 Irish;
- And of the over 88 privately held, Israeli-founded unicorns in the US, 30 are in New York (vs. 35 in San Francisco).

Market Share
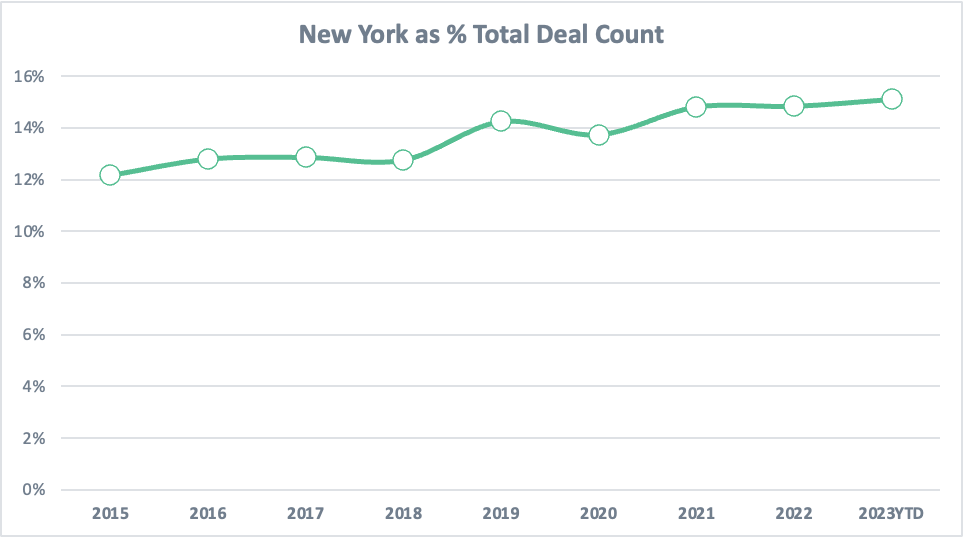
The share of total US venture deals in New York Metro headquartered startups crossed 15% in 2023 for the first time, up from 14.8% in 2022. In comparison, the Bay Area represented 23% of the total.
On a volume basis New York’s share declined to 11.8% in 2023 from 12.7% in 2022 (vs. 36% for the Bay Area).
The region had an outsized share in fintech, with over 24% of all dollars pouring into fintechs. Other areas of concentrated capital included Construction Tech, eCommerce, Mobile, Real Estate Tech and AdTech.
Within AI and ML deployment, New York represented 14% of total deal count, slightly up on 2022.
Where was New York significantly behind the Bay Area?
- CloudTech/Dev Ops (Bay Area has a 38% market share vs. 12% NY);
- AI and ML deployment (35% market share vs. 15%);
- Big Data (36% market share vs. 16%);
- Cyber (29% market share vs. 13%)
Top 5 Sectors from 2015 to 2023 in the New York Metro
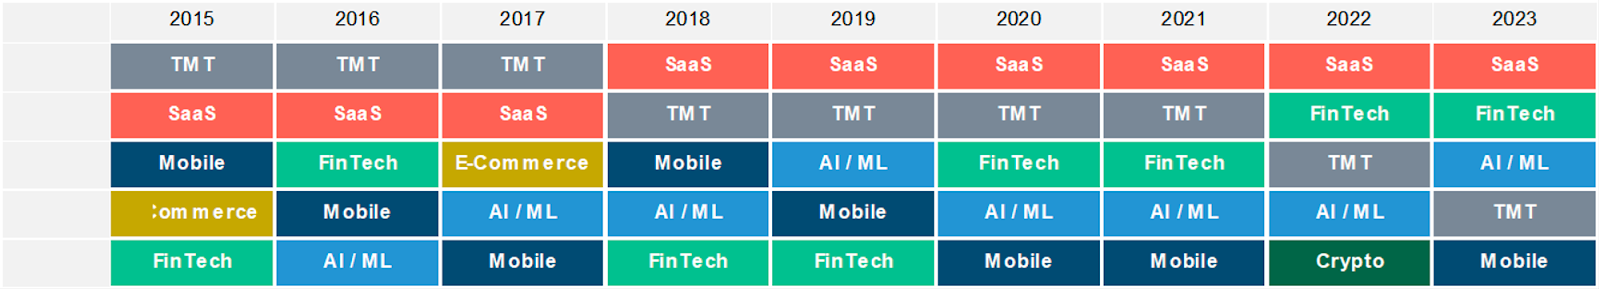
SaaS and Fintech remained the two most active sectors in 2023, with AI / ML deployment and HealthTech taking a larger share of the total capital invested YTD.
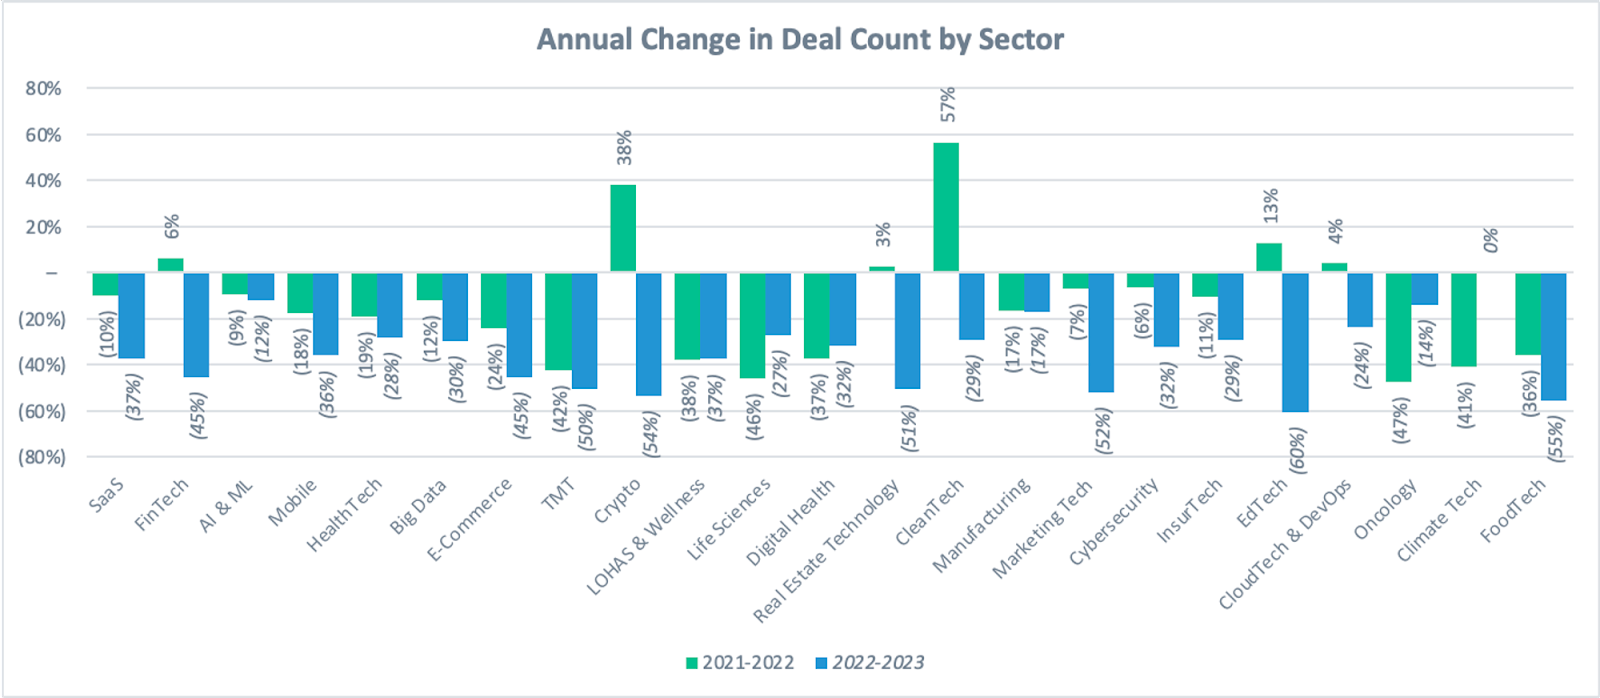
With regards to the annual change in the total deal count by sector, SaaS and Fintech verticals were down (37%) and (45%) respectively YoY. Sectors in which deal count declined by more than >(50%) included TMT, Crypto, Real Estate Tech, EdTech and FoodTech. This is reflective of the specific sub sector public market multiple depreciation and the subsequent re-evaluation of valuation framework in the private markets.
The sectors less affected included AI & ML deployment (<10% decline). This is despite the challenging broader environment — with substantial sub-vertical fundraising around generative AI, underscoring the high expectations from investors.
Growth areas, defined as sectors in which the number of deals grew YoY, include CleanTech, Construction Tech / Advanced Manufacturing, AudioTech, Virtual Reality and Wearables.
Exit Environment / IPO and M&A Exits
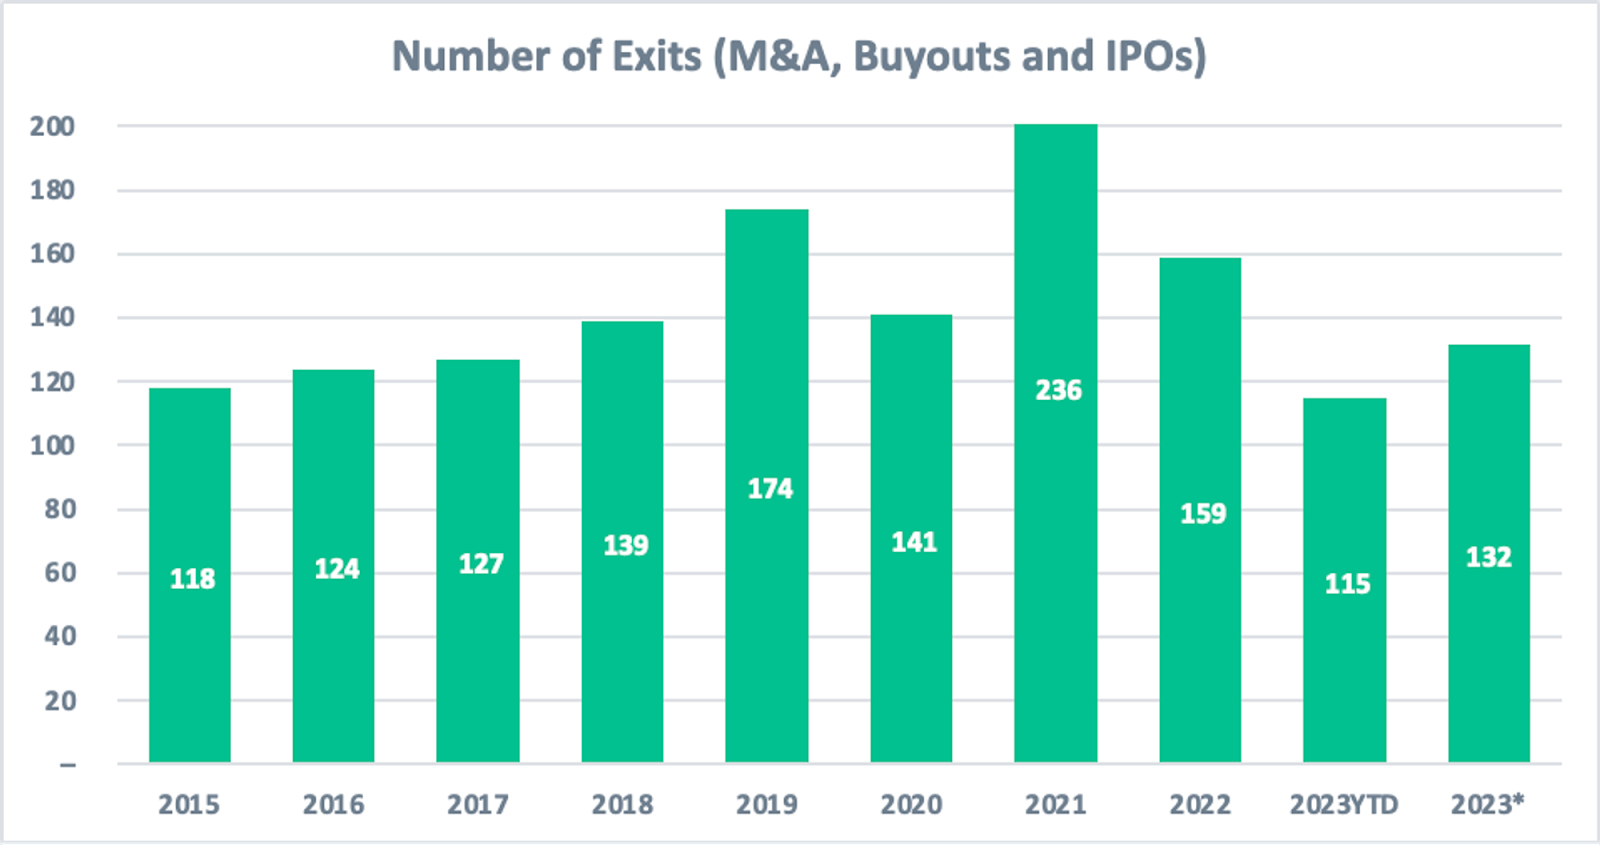
Realized outcomes through IPOs and M&A are indicative of the current investor appetite and act as catalysts for future innovation, with investors often reinvesting their gains in other startups, creating a positive feedback loop in the ecosystem.
From an exit perspective, the number of mergers and acquisitions or IPOs of VC-backed businesses, reduced from 159 in 2022 to 132 in 2023¹.
Notable exits in 2023 of previously VC-backed companies included:
- Intercept, a biotech focused on novel therapeutics. Acquired by Alfasigma Group for $800M;
- Dig Security, data security software designed to discover, monitor and protect cloud data in real-time. Acquired by Palo Alto Security for an undisclosed sum;
- Biohaven, a clinical-stage biopharmaceutical company raised $225M in its IPO on the New York Stock Exchange under the ticker symbol $BHVN;
- Power, a fintech offering next-generation co-branded credit cards. Acquired by Marqeta ($MQ) for $220M;
- Blue Apron, a consumer brand offering meal delivery. Acquired by Wonder for $103M;
- Paperspace, a cloud-based virtual desktop platform. Acquired by Digital Ocean ($DOCN) for $111M;
- Mitokinin, a biotech focused on small molecule therapeutics. Acquired by AbbVie ($ABBV) for $110M;
- Lexeo, a clinical stage genetic medicines company raised $100M in its IPO on the NASDAQ stock exchange under the ticker symbol of LXEO;
- Jeeng, an email marketing application. Acquired by OpenWeb for $100M.
“Bid-Ask” Spread
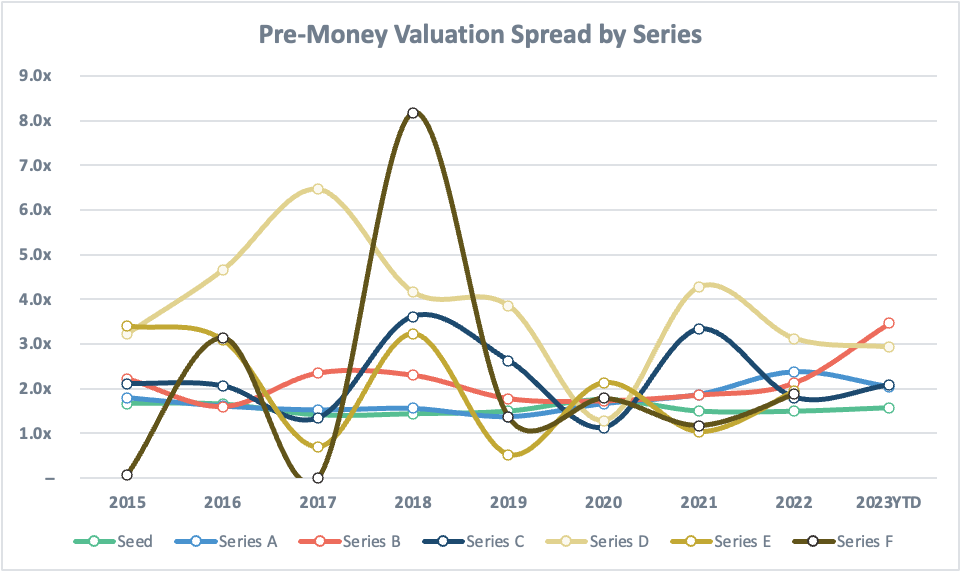
The bid-ask spread is an indicator of volatility in the ecosystem i.e. a wide bid-ask spread can suggest lower liquidity and a narrow bid-ask indicates high liquidity and lower volatility. It may also signal that investors hold different expectations of startup valuations.
The above chart takes pre-money valuation spread as a proxy for bid-ask spread. This is calculated as the 75th percentile pre-money valuation less the 25th percentile, divided by the 25th percentile.
The chart is noisy but there are some trends to observe for 2023:
- Firstly, the bid-ask spread for early-stage investments (Seed and Series A) has tightened.
- On the other hand, growth-stage investments (Series B and Series C) have broadened. See the spike up for Series B startups? This is likely due to the limited price discovery at this mid-growth stage.
- The thinking is as follows: Whereas, late-stage growth startups have been more precipitously affected by the reduction in public company valuation multiples, the valuation framework is weakened the earlier you invest. In a market where venture capital dollar deployment has reduced and valuation sensitivity increased, high quality assets continue to demand a premium. This is due to the flight to quality amongst investors, chasing the fewer high quality startups and founders that decided to fundraise. On the other end of the scale, we have more Series A extensions and insider rounds. Hence the increase in the bid-ask spread at the Series B stage especially.
Largest Deals by Absolute Dollar Size
Moving away from the prescribed labeling of Seed / Series A etc and instead to that of an absolute dollar invested, Fintech and AI/ML deployment took an outsized share of the >$150M size rounds in 2023.
Including a breakdown below on the largest announced deals by size 2023-YTD:
- 0 deals > $500M (vs. 2 in 2022)¹
- 5 deals >$250M (vs. 24 in 2022)¹
- Clear Street, a prime brokerage platform. Raised $435M Series B at $1.54B pre-money led by Prysm;
- Amplify, a next-gen curriculum and assessment programs. Raised $350M Series C at $1.5B pre-money led by Cox;
- Ramp, a financial operations platform for expense management, corporate card and spend management. Raised $300M Series D at $5.5 pre-money;
- Wiz, a cloud infrastructure security platform. Raised $300M Series D at $10B pre-money led by Lightspeed, Index and Greenoaks;
- Ambient Fuels, a custom generated green hydrogen projects. Raised $250M Series led by Generate
- 14 deals >$150M (including the 5 noted above)
- Hugging Face, a data science platform with ready to use datasets for ML models. Raised $235M at $4.3B led by Salesforce Ventures;
- Paradigm, a clinical trial and research platform. Raised $203M led by ARCH;
- Kite, an eCommerce platform focused on scaling brands. Raised $200M led by Blackstone and Juxtapose;
- Kindbody, an employee fertility benefit solution. raised $191M led by Morgan, Squarepoint and Perceptive;
- RunwayML, a creative suite applying generative AI tools on video and image editing. Raised $151M led by Google and Nvidia;
- Amelia, an enterprise focused conversational AI. Raised $175M led by BuildGroup and Monroe;
- BlockPower, a climate tech startup focused on clean energy solutions for homeowners and small businesses. Raised $155M led by VoLo;
- AlphaSense, a financial / market intelligence and search engine. Raised $150M Series E at $2.35B pre-money;
- HiBob, a HR and benefits platform. Raised $150M led by Farallon Capital
- 32 deals >$100M (vs. 56 in 2022)
- 65 deals >$50M (vs. 121 in 2022)
- 147 deals >$25M (vs. 247 in 2022)
- 369 deals >$10M (vs. 490 in 2022)
- 763 deals > $1M (vs. 1,273 in 2022)
Round Sizes (log scale)
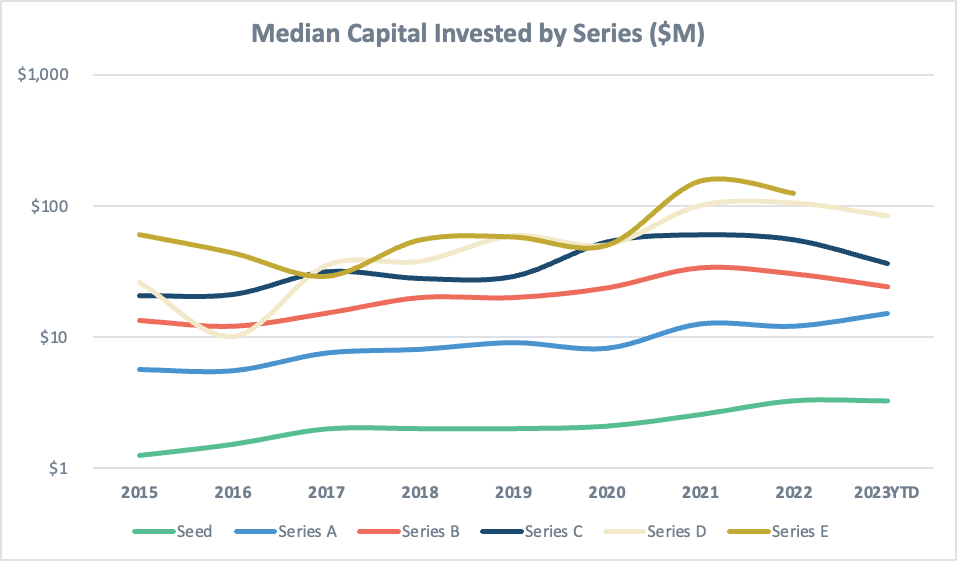
Startup round sizes (invested capital per round), typically correlates with valuations (the price per share), signaling greater investor confidence. Capital also impacts growth planning (how many months of cash runway) and one’s ability to aggressively expand and hire.
There was a bifurcation in the absolute dollar round size per series, with early stage investments (seed and Series A) continuing to climb. In contrast, growth-stage round sizes (Series B, C and D) have continued to fall and have yet to find a new equilibrium. In continuation with the narrative above, the growth-stage continues to face more challenges than early-stage investing.
The median round size (capital invested) by Series were:
- $3.3M Seed vs. $3.3M in 2022 (flat YoY);
- $15M Series A vs. $15M (+25% YoY);
- $24M Series B vs. $31M ((21%) YoY);
- $36M Series C vs. $55M ((34%) YoY);
- $83M Series D vs. $105M ((20%) YoY).
Valuations (log scale)
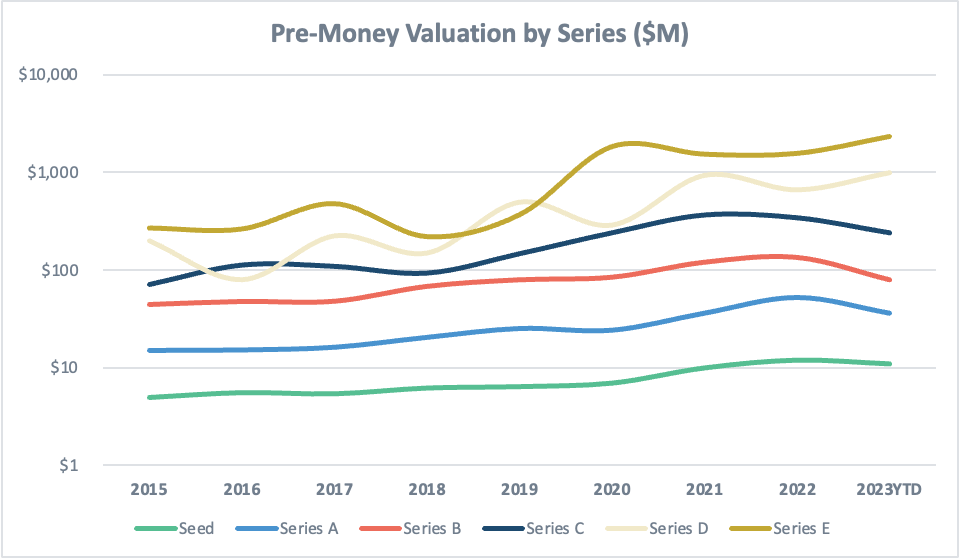
From a valuation perspective, pre-money valuations across Seed through to Series C series were down, with Series B post-money valuation mediums falling the most year-on-year.
The median pre-money valuation by Series were:
- $11M Seed vs. $12M in 2022 ((8%) YoY);
- $36M Series A vs. $52M ((31%) YoY);
- $80M Series B vs. $136M ((41%) YoY);
- $240M Series C vs. $342M ((30% YoY);
- $1B Series D vs. $668M (+50% YoY) (limited sample size)
In summary, the jump-ups in valuation from the Seed -> Series A and Series A > B were less material than in 2022.
In 2023, there was a 3.2x delta from Seed ($11M pre-money) to Series A ($36M) and a 2.2x delta to Series B ($80M). In comparison, in 2022, that step-up was more material at 4.3x Seed > Series A and 2.6x Series A > Series B respectively. The floor to go out to raise the subsequent round should in theory be lower for startups in this period.
Venture Capital Fundraising
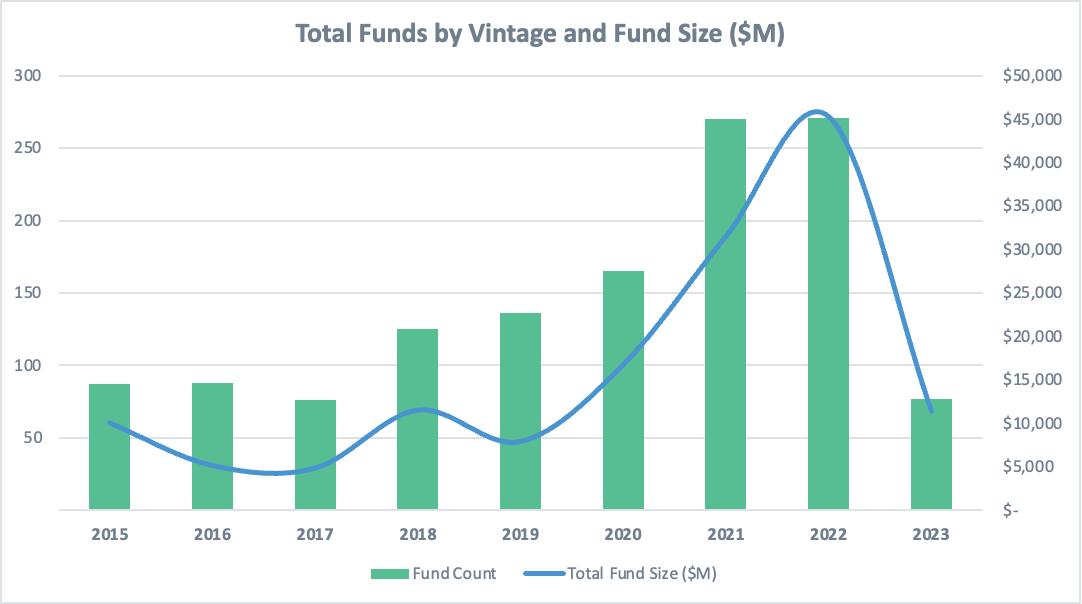
Venture capital fundraising is a leading indicator for future investment in startups, with a reduction in funds determining capacity to invest. The broader market environment also impacts the velocity of fund deployment / lifecycle and ability to provide follow-on funding to successful portfolio companies.
In total there were 77 new venture capital funds raised by New York headquartered institutions in 2023, down from 271 in 2022¹.
The total fund size of those 77 funds was $11.4B, down (75%) YoY compared to the $45.3 in 2022¹.
When assessing dry powder of NY headquartered venture capital funds, the trailing 5 years of vintages in aggregate have swelled to over $88B in available capital to deploy. There remains plenty of dry powder available also due to the reduced velocity of fund deployment (i.e. in the last year the (funds raised + existing capital) > deployed capital).
Tech Jobs
Finally, the number of technology jobs hired and posted are an important indicator of the health of the startup ecosystem. More tech job openings means that startups are scaling operations and growing.
Including all sectors, the New York Metro area added 227k Jan-23 through to Jul-23 (compared to 497k YTD-22 for the equivalent time frame).
With respect to net new tech employment jobs, New York is projected to add 12.9k tech jobs in 2023, compared to 18.4k in 2022. In comparison, the US added +286k net tech employment jobs in 2022 and is forecast to add 272k in 2023.
As a percentage of the total net tech jobs, New York 6.4% in 2022 and 4.7% in 2023 representing some relative slowdown.
Post Pandemic, New York experienced the 2nd largest increase in tech workers in the US after the Bay Area, followed by metro areas such as Boston, Austin and Seattle. This continued growth in the tech sector will be detrimental to New York’s recovery to pre-pandemic employment levels. At present, New York’s unemployment rate is 5.4% (vs. 3.9% nationwide) and has yet to fully recover to its pre-pandemic level of 4.3%.
Methodology
Sources: Pitchbook, Crunchbase, Stanford Business Insights, Stanford University Research, City of New York, NYC Gov and CompTIA State of Tech Workforce.
Financings include equity deals raised in USD by NY-headquartered corporations.
Sector / verticals are not de-duplicated for companies that sit across multiple sub sectors.
Unicorn tags are based on publicly available information and undisclosed valuations are not included.
¹2023 figures are annualized for Year to date (YTD) as of November 23, 2023.
Authors