Remove Dilution Remove Green Remove Metrics Remove Sales
article thumbnail

Responses to Negative Data: Four Senior Leadership Archetypes.

Occam's Razor

When you do that much stuff, and you can measure almost everything… The result is that our ecosystem of data people are returning a lot more negative data when measuring performance of Marketing, Sales, User Experience and Customer Service. They dilute the analysis with non-facts. You might think it would be the Attacker.

article thumbnail

Marching through quicksand

Startup Lessons Learned

Despite all the energy invested in talking to authors about the size of their platform, very few gatekeepers have a rigorous set of metrics for measuring it. When I reviewed a recent product development book, it immediately shot up to Amazon sales rank 300. My blog has over 14000 subscribers, for example. Is that a lot? Is that good?

Insiders

Sign Up for our Newsletter

This site is protected by reCAPTCHA and the Google Privacy Policy and Terms of Service apply.

article thumbnail

What is Brand Identity and How To Create a Great One: A Complete Guide for Marketers and Businesses (2019)

crowdSPRING Blog

There are three parts to a good competitive analysis: (1) defining the metrics and identifying the competitors you’re comparing, (2) gathering the data, and (3) the analysis. If your brand tries to be too many things at once, the message becomes scattered and the brand grows diluted. Start by defining what metrics are important.

Marketing 162
article thumbnail

Crazy! 189 Answers To The Top Startup Questions On Your Mind

maplebutter.com

Written By Dan Martell on February 2nd, 2012 | Category: Hiring LeanStartup Marketing Metrics Startup Life | 6 Comments. Building Metrics / Usage Reports / KPI 3. Product/Metrics (70%/30% time) * Get your product activation (sign-up + meaningful action) to 60% * then, Get your product retention to 20% weekly. Why do I do it?

article thumbnail

People-First Capitalism

Reid Hoffman

When I was at RISD, I went to Rhode Island School of Design, there was this idea that was emerging called The Green Movement, the sustainability movement. At the time, they said, it’s not enough to design a product that’s good for sales, it must also be good for the environment. Well, that same thing can be said for any product.

article thumbnail

8 Data Visualization Examples for Marketers

ConversionXL

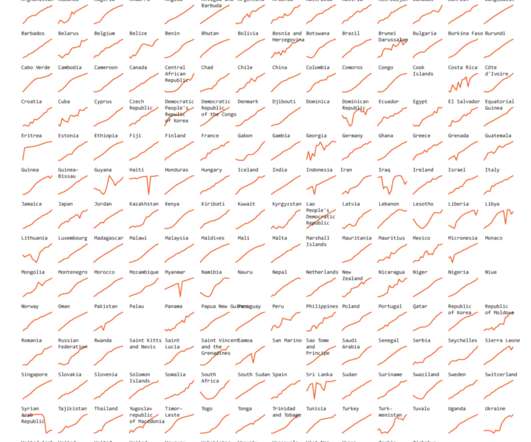
Within that dashboard is a funnel chart: The funnel bar chart shows the number of users at each stage of the sales funnel. Likewise, green can mean “good.” Alt Tag: Example from a presentation by Brent Dykes that shows how unnecessary noise dilutes data. Red can mean “bad,” “danger,” or “alarm.” Keep it simple.

Marketing 100